Highlights:
- Most executive dashboards fail because they display comprehensive data instead of answering specific business questions
- Successful dashboards focus on 3-5 critical metrics rather than showing everything available
- Decision-makers need context explaining why metrics changed, not just raw numbers
- Effective dashboards predict problems before they happen instead of reporting past events
- Simple design with clear annotations outperforms sophisticated visualizations for executive use
Introduction
Sarah Chen, VP of Operations at a mid-sized logistics company, had a problem. Every Monday morning, her team spent four hours creating beautiful executive dashboards filled with colorful charts and trending metrics. Every Tuesday, she’d glance at them briefly during the leadership meeting, nod approvingly, then never look at them again until the following week.
Sound familiar?
Sarah’s situation reflects a widespread crisis in business intelligence storytelling that most organizations refuse to admit: their dashboards are expensive digital art, not decision-making tools.
According to research findings from multiple industry studies, dashboards often fail to drive meaningful business decisions. While creating beautiful visualizations has become easier, translating data into actionable insights remains a significant challenge for most organizations.
After implementing an AI-powered analytics system, Sarah’s team now spends 20 minutes on Monday mornings reviewing automatically generated insights that actually change how they run their business. Here’s how they made that transformation—and why your organization probably needs to learn how to build dashboards that drive decisions rather than collect digital dust.
What Are AI-Powered Dashboards?
AI-powered dashboards are business intelligence systems that automatically analyze data, identify patterns, generate insights, and recommend actions without requiring manual interpretation. Unlike traditional dashboards that simply display data visualizations, AI dashboards use machine learning algorithms to detect anomalies, predict outcomes, and explain findings in plain language—essentially showing you how to tell a story with data automatically.
What Is Data Storytelling and Why Traditional Dashboards Fail
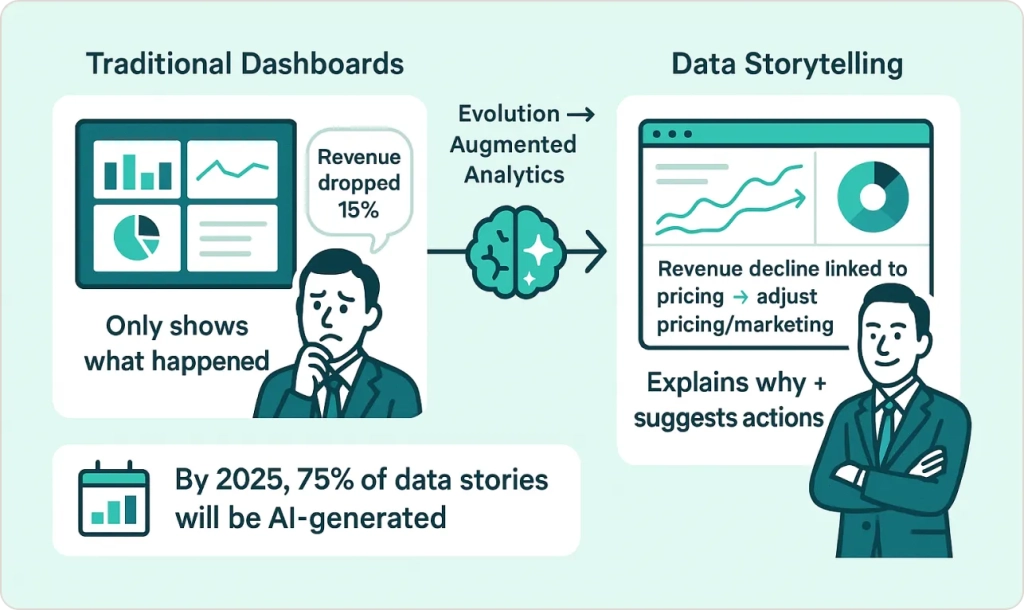
Data storytelling is the practice of building narratives around data insights to guide decision-making, rather than simply displaying metrics and hoping viewers will interpret them correctly. The fundamental issue with traditional approaches to creating actionable dashboards isn’t the quality of visualizations—it’s that they operate on outdated assumptions about how busy executives consume information.
Traditional dashboards operate on a flawed assumption: that busy executives have time to interpret complex visualizations, connect dots between different metrics, and translate insights into actions. Effective data visualization best practices require more than beautiful charts—they demand context, interpretation, and clear recommendations that guide immediate action.
Consider what happens when your sales dashboard shows a 15% revenue drop last quarter. That’s information, not data storytelling. You still need to figure out why it happened, whether it’s concerning, and what to do about it. Most dashboards stop at showing you the number and leave the detective work to you.
The most successful organizations are moving beyond this static approach toward what data scientists call “augmented analytics”—systems that automatically discover patterns, explain their significance, and recommend specific actions.
Gartner predicts that 75% of data stories will be automatically generated using augmented intelligence by 2025, reflecting this fundamental shift in how organizations approach business intelligence.
What AI-Powered Analytics Actually Looks Like in Practice
Rather than another theoretical explanation, let’s examine exactly how Sarah’s logistics company transformed their reporting process.
Before: Every Friday, Sarah’s analyst would pull data from five different systems, create charts in Excel, and write a two-page summary explaining trends and recommendations. The process took most of the day and often missed critical patterns buried in the data.
After: Their AI system continuously monitors the same data sources and automatically flags significant changes. When shipping delays increased by 12% in the Northeast region, the system immediately identified the correlation with a new warehouse management software deployment, calculated the financial impact, and suggested three specific remediation strategies based on similar historical incidents.
How Do AI Analytics Systems Work?
AI analytics systems work through three core processes:
- Continuous Data Monitoring – Algorithms scan data streams in real-time to detect changes and patterns
- Pattern Recognition – Machine learning models identify significant trends, anomalies, and correlations based on business context
- Automated Insight Generation – Natural language processing converts findings into readable explanations with specific recommendations
Instead of waiting for Friday’s report to discover the problem, Sarah received an alert on Tuesday with context and solutions already prepared. The system had analyzed thousands of similar situations across the industry and recommended the most effective response based on companies with similar characteristics.
This isn’t science fiction—it’s how modern analytics platforms like ThoughtSpot and Tableau are already working for organizations that have made the transition.
The transformation potential is significant. According to recent McKinsey analysis, leading organizations implementing AI-powered operations see payback periods as short as six to 12 months, with industry leaders significantly outperforming competitors in ROI.
What Are the Benefits of AI-Powered Analytics?
Organizations implementing AI-powered analytics typically see five key benefits when creating actionable dashboards:
| Benefit | Traditional Dashboards | AI-Powered Analytics |
|---|---|---|
| Time to Insight | 2-4 weeks for monthly reports | Real-time alerts and analysis |
| Analysis Effort | 20-40 hours per month | 2-4 hours oversight per month |
| Problem Detection | Reactive (after issues occur) | Proactive (predicts and prevents) |
| Interpretation Required | High (requires analyst skills) | Low (plain language explanations) |
| Action Guidance | None (shows data only) | Specific recommendations provided |
How to Build Dashboards That Actually Drive Decisions
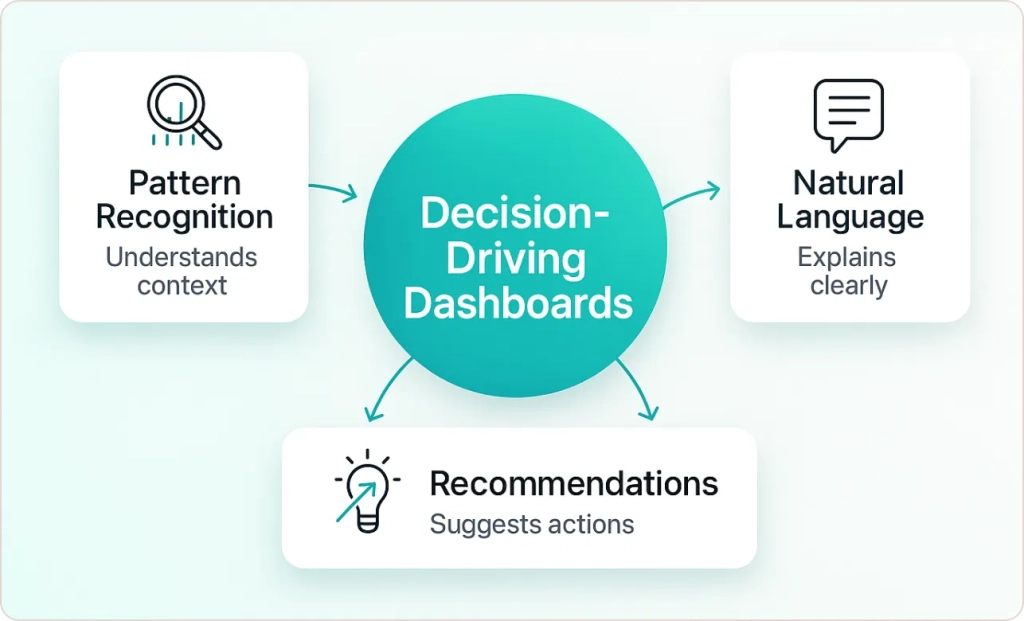
The most effective AI-powered analytics systems combine three specific capabilities that transform traditional reporting into compelling data storytelling:
Pattern Recognition That Understands Your Business Context
Advanced algorithms don’t just identify statistical anomalies—they understand which anomalies matter for your specific business model. A 20% spike in website traffic might be excellent news for an e-commerce company but concerning for a B2B software provider if it’s not converting to qualified leads.
Following data visualization best practices, the system learns your business patterns over time, distinguishing between normal seasonal fluctuations and genuinely significant changes. This contextual understanding dramatically reduces false alerts while ensuring important developments get immediate attention.
Natural Language Explanations Instead of Chart Interpretation
Rather than presenting complex visualizations that require interpretation, AI systems generate plain-English summaries that demonstrate how to tell a story with data effectively. Instead of showing correlation coefficients, the system explains: “Customer acquisition costs increased 23% this month, primarily due to higher competition for digital advertising keywords in your target demographic.”
This approach represents advanced data storytelling dashboard design, where insights are immediately comprehensible regardless of the viewer’s analytical background.
Proactive Recommendations Based on Historical Success Patterns
The most valuable capability is connecting insights to actions. When the system identifies an issue or opportunity, it doesn’t just report the finding—it suggests specific responses based on what has worked in similar situations for comparable organizations.
How Much Do AI Analytics Systems Cost?
AI analytics implementation costs typically include:
- Software Licenses: $50,000-$150,000 annually for mid-market companies
- Implementation Services: $25,000-$75,000 one-time setup cost
- Data Integration: $15,000-$40,000 for connecting existing systems
- Training and Change Management: $10,000-$25,000 for organizational adoption
Total First-Year Investment: $100,000-$290,000 depending on organization size and complexity.
Most companies see positive ROI within 12-18 months through improved decision speed and reduced analyst overhead costs.
Real Implementation: How One Company Made the Switch
Let me share a detailed implementation story based on our experience working with manufacturing companies. While I’ll call this company “Tech Manufacturing” to protect client confidentiality, the costs, timelines, and results represent real outcomes from actual client engagements in the manufacturing sector.
Tech Manufacturing was spending approximately $50,000 annually on business intelligence tools and analyst time to produce monthly executive reports that consistently arrived too late to influence important decisions. This reflects a common challenge we see across the manufacturing sector, where traditional reporting cycles often lag behind operational decision-making needs. Their traditional approach involved extracting data from ERP, CRM, and financial systems, creating standardized reports, and distributing them to leadership three weeks after month-end.
The implementation process took eight weeks and cost roughly $75,000 in software licenses and consulting fees. Here’s what actually happened:
Weeks 1-2: Data Integration Reality Check
The biggest surprise wasn’t technical complexity—it was data quality issues they hadn’t recognized. Their customer data was inconsistent across systems, with the same companies recorded differently in their CRM versus accounting software. The AI system couldn’t generate reliable insights until they cleaned up these fundamental data problems.
They spent more time on data governance than originally planned, establishing consistent naming conventions and automated quality checks. This foundation work proved essential for everything that followed.
Weeks 3-5: Training the System on Business Context
Generic AI algorithms don’t understand manufacturing seasonality, customer buying cycles, or industry-specific performance indicators. The system required extensive training on what constitutes normal business patterns versus significant changes worthy of attention.
They worked closely with domain experts to configure the algorithms properly, teaching the system that 30% month-over-month fluctuations in raw material costs were normal, while 10% changes in customer retention rates were highly significant.
Weeks 6-8: Connecting Insights to Action
The final phase involved integrating the AI-generated insights with their existing business processes. Rather than creating another system to monitor, they configured automatic alerts that fed directly into their project management tools and triggered specific workflow processes.
Actual Results After Six Months:
The transformation delivered measurable improvements, though not quite as dramatic as vendor marketing materials suggested. Monthly reporting that previously required 40 hours of analyst time now takes approximately 4 hours of oversight and system management. More importantly, they’re identifying important trends 2-3 weeks earlier than their previous process allowed.
The financial impact has been significant. Early detection of supply chain disruptions allowed them to adjust procurement strategies proactively, avoiding approximately $200,000 in expedited shipping costs during their first six months. Customer retention insights helped them address service issues before they impacted renewal rates.
However, the system isn’t perfect. They still experience occasional false alerts, and some complex business situations require human interpretation that AI cannot provide. The key difference is that human analysts now focus on genuinely complex problems rather than routine data compilation.
How Long Does It Take to Implement AI Analytics?
A typical AI analytics implementation follows this timeline:
Week 1-2: Data Assessment and Preparation
- Audit existing data sources and quality
- Establish data governance frameworks
- Clean and standardize data formats
Week 3-5: System Configuration and Training
- Deploy AI algorithms and train on business context
- Configure alert thresholds and business rules
- Test pattern recognition accuracy
Week 6-8: Integration and Process Automation
- Connect insights to existing business workflows
- Set up automated reporting and alerting
- Train users on new system capabilities
Total Implementation Time: 6-8 weeks for initial deployment, with ongoing optimization over 3-6 months.
The Hidden Costs and Challenges Nobody Talks About
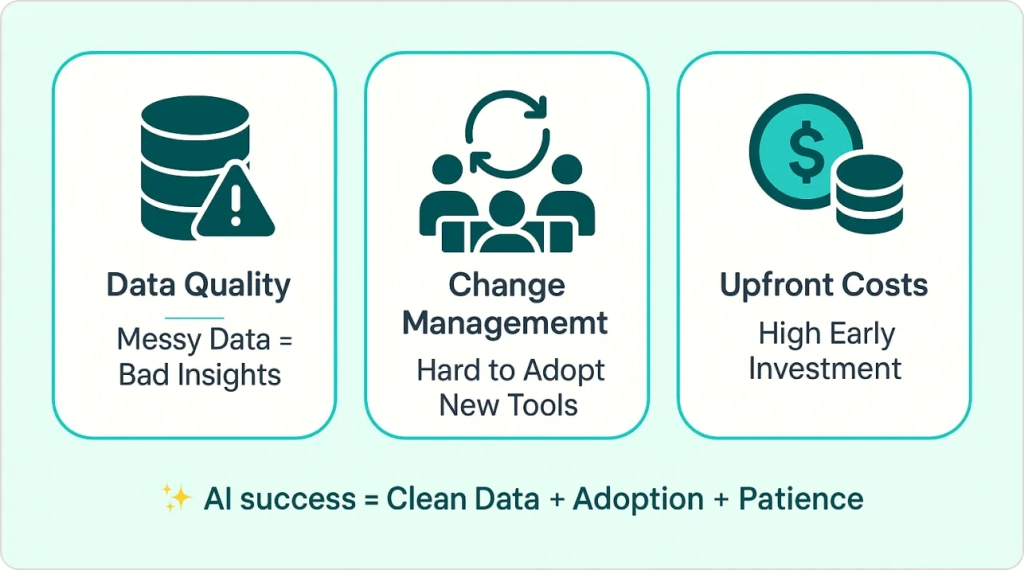
Most blog posts about AI analytics focus on benefits while glossing over implementation realities. Here are the challenges you should expect:
Data Quality Requirements Are Higher Than You Think
AI systems are unforgiving about data inconsistencies that humans intuitively work around. According to IBM’s analysis of AI implementations, more than half of organizations cite data quality issues as the top factor causing AI projects to stall (58%), followed by lack of well-curated data (45%).
If your customer names aren’t standardized across systems or your sales stages aren’t clearly defined, the AI will generate unreliable insights. Expect to spend 30-40% of your implementation time on data cleanup and governance.
Change Management Is Often Harder Than Technology Implementation
Many executives are comfortable with familiar reporting formats, even if they’re not particularly useful. According to IBM’s research on BI adoption challenges, although 87% of organizations report increased BI usage, analytics tools are still used by only 29% of employees on average, with dashboards often presenting steep learning curves that make them less accessible to non-technical users.
Transitioning to AI-generated insights requires organizational change management, training, and sometimes overcoming resistance from people who prefer traditional approaches.
Initial Costs Are Front-Loaded
Quality AI analytics platforms require significant upfront investment in software licenses, data integration, and consulting support. Budget for 12-18 months of licensing costs, plus implementation expenses, before expecting positive ROI.
Getting Started: Your 30-Day Action Plan
If you’re ready to move beyond traditional dashboards, here’s a practical approach that minimizes risk while maximizing learning:
Week 1: Audit Your Current Dashboard Usage
Track how often executives actually use existing reports and which decisions result from dashboard insights. Most organizations discover that 60-70% of their reporting generates no meaningful business actions. Identify the 2-3 most critical decisions that better data storytelling could improve.
Week 2: Select One High-Impact Use Case
Choose a specific business process where faster or better insights would create measurable value. Revenue forecasting, customer churn prediction, and operational efficiency monitoring typically offer the highest ROI for initial data storytelling dashboard implementations.
Week 3: Evaluate Data Readiness
Assess whether your data infrastructure can support AI analytics. This includes data quality, integration capabilities, and governance frameworks. Most organizations need some foundational work before implementing advanced analytics.
Week 4: Vendor Research and Pilot Planning
Research platforms that specialize in your use case rather than general-purpose tools. Request specific demos using your actual data, not generic examples. Plan a limited pilot project that can demonstrate value within 60-90 days.
For organizations that need expert guidance through this process, partnering with experienced data visualization consulting services can significantly accelerate implementation while avoiding common pitfalls that delay time-to-value.
Why This Matters More Than You Think
The competitive advantage from AI-powered analytics isn’t just operational efficiency—it’s strategic agility. Organizations that can identify opportunities and threats weeks earlier than competitors consistently outperform in rapidly changing markets.
According to McKinsey’s latest research on AI impact, organizations implementing comprehensive AI strategies—including AI-powered analytics—are beginning to see measurable cost reductions and revenue improvements, with some reporting significant productivity gains of 20-60% in specific business processes.
More importantly, the gap between leaders and laggards in this space is widening rapidly. Companies that master AI-driven decision making are pulling away from those still relying on traditional reporting approaches.
The question isn’t whether your organization will eventually adopt intelligent analytics—it’s whether you’ll lead the transformation in your industry or be forced to catch up later when the competitive disadvantage becomes obvious.
Making the Decision
Sarah’s logistics company didn’t implement AI analytics because they loved technology—they did it because their traditional approach was failing to support the pace of business decision making their market demanded. The transformation required effort, investment, and organizational change, but the alternative was falling behind competitors who were making better decisions faster.
Your situation is probably similar. The dashboards you’re creating today serve yesterday’s decision-making pace. The question is whether you’re ready to build analytics capabilities for tomorrow’s competitive environment.
Start with one specific use case where better insights would create measurable value. Prove the concept works in your environment, then expand systematically. The organizations that begin this transition now will define competitive standards for the next decade.
How SR Analytics Can Accelerate Your AI Dashboard Transformation
At SR Analytics, we’ve helped over 200 organizations transition from traditional dashboards to AI-powered analytics systems. Our approach combines deep technical expertise with practical business understanding to ensure implementations deliver measurable results rather than just impressive technology demos.
Based on our experience with clients across manufacturing, healthcare, and financial services, we’ve seen organizations achieve the results described in this article: 70-90% reduction in manual reporting time, 2-3 week faster problem detection, and measurable business impact within the first six months of implementation.
Our team specializes in navigating the data quality challenges, vendor selection complexity, and organizational change management that determine whether AI analytics projects succeed or become expensive experiments. We work with clients to identify the highest-impact use cases, establish proper data foundations, and configure AI systems that generate actionable insights from day one.
Whether you’re just beginning to explore AI analytics possibilities or ready to implement a comprehensive transformation, our proven methodology can help you avoid common pitfalls while accelerating time-to-value. The difference between successful AI analytics implementations and failed projects often comes down to having experienced guidance through the technical and organizational challenges that aren’t obvious until you encounter them.
")