Highlights
- 28% faster decision-making and 50% less time spent on reporting
- 23x higher customer acquisition likelihood with expert guidance
- Data visualization market projected to hit $18.36B by 2030
- $13.01 average ROI per $1 invested in visualization consulting
- Success depends more on strategy and expertise than tools
- Impact grows when team readiness and system complexity are addressed
Introduction
I’ve spent the last decade helping organizations transform their data chaos into decision-making gold, and there’s a pattern I keep seeing that honestly frustrates me: businesses drowning in spreadsheets while their competitors are making lightning-fast decisions based on clear visual insights.
Here’s what really caught my attention during a recent client meeting: while 78% of organizations now use AI and analytics tools, 62% of executives still make critical decisions based on gut feelings rather than data. That disconnect isn’t just a missed opportunity—it’s a competitive vulnerability that I’ve watched sink otherwise successful businesses.
The stakes couldn’t be higher. Companies that master the benefits of data visualization are 23 times more likely to acquire customers and 6 times more likely to retain them[1]. But here’s what I’ve learned from data visualization experts: the difference isn’t usually about which tool you choose—it’s about having the right expertise to implement it strategically.
In this guide, I’ll share the six benefits of data visualization that consistently deliver the highest impact, help you understand what is a data visualization consultant and the role of data visualization in business growth, and determine when partnering with data visualization consultant expertise makes strategic sense versus trying to build capabilities internally.
What Is a Data Visualization Consultant?
Let me clear up some confusion I encounter constantly: what is a data visualization consultant isn’t someone who just makes your charts prettier. The data visualization experts I’ve worked with who deliver real business impact are strategic partners who solve three problems most organizations struggle with simultaneously.
First, they bridge the technical gap. I’ve seen too many internal teams spend months learning Tableau or Power BI, only to create dashboards that technically work but don’t actually support decision-making. Understanding what is a data visualization consultant means recognizing that they solve this by combining multiple expertise areas. A skilled data visualization consultant combines:
- Deep platform expertise across tools like Power BI, Tableau, and Qlik
- Design principles that make complex data intuitive and actionable
- Business understanding of decision-making processes
- Technical skills for data integration and performance optimization
Second, they understand business context. The best visualization consultants I know don’t start with technology—they start by understanding how decisions actually get made in your organization. They ask critical questions:
- Who needs to act on these insights?
- What decisions are you trying to improve?
- What happens when the data conflicts with expectations?
- How do different teams currently collaborate on data-driven initiatives?
Third, they bring external perspective. When I review failed internal visualization projects, I often find teams recreating existing reports in new tools rather than rethinking how data flows through their organization. External data visualization experts see optimization opportunities that internal teams miss due to familiarity with existing processes.
How they differ from in-house analysts is crucial to understand when evaluating the benefits of data visualization:
Data Visualization Consultants:
- Redesign how entire organization interacts with data
- Bring proven methodologies from multiple implementations
- Provide specialized expertise in advanced visualization techniques
- Deliver project-focused intensity with defined timelines
In-House Analysts:
- Answer specific business questions using existing tools
- Offer deep knowledge of internal systems and processes
- Provide ongoing operational support and maintenance
- Build long-term relationships within the organization
Here’s what I tell clients about tools and platforms when choosing among data visualization service providers: be wary of any consultant who pushes a specific solution before understanding your requirements. The best data visualization experts are platform-agnostic, recommending solutions based on:
- Your current data architecture and integration needs
- User technical capabilities and training requirements
- Budget constraints and licensing preferences
- Scalability requirements for future growth
Role of Data Visualization in Business Growth
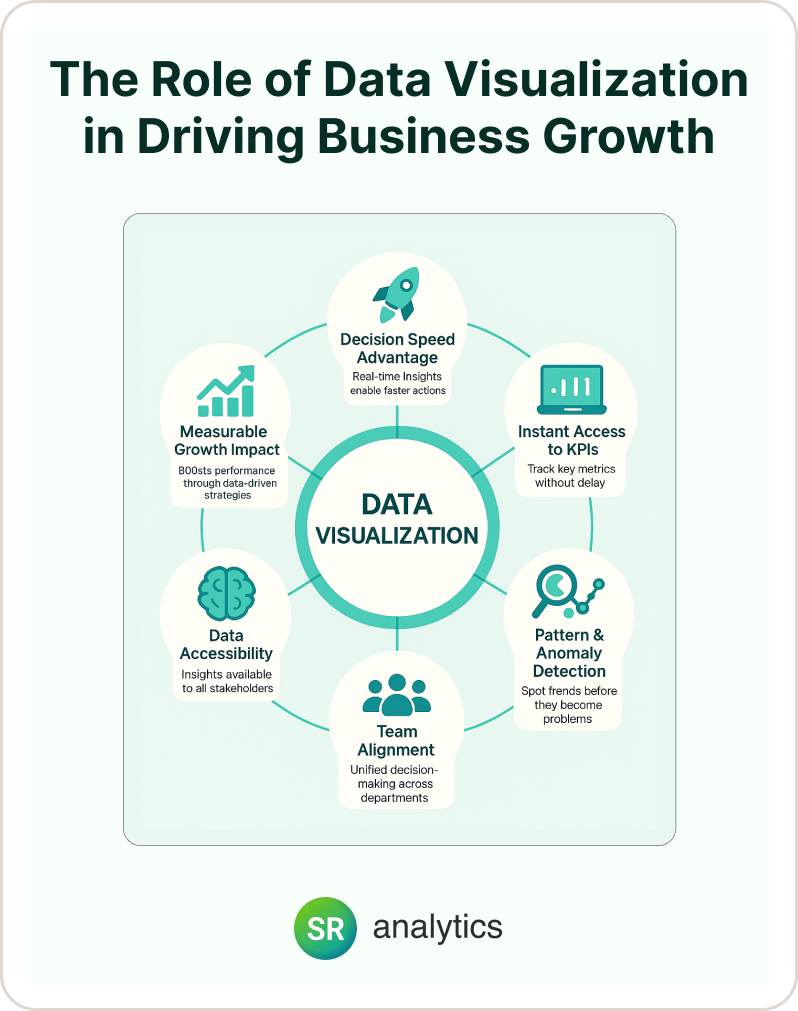
The role of data visualization in driving growth extends far beyond making data “look nice”—it fundamentally changes organizational responsiveness and decision quality. When data visualization experts properly implement solutions, the benefits of data visualization become evident across all business functions.
Empowering real-time decisions represents the most significant competitive advantage I’ve helped organizations achieve. Traditional reporting creates decision delays—by the time you compile, analyze, and distribute insights, market conditions have often changed.
Proper visualization provides:
- Instant access to key performance indicators
- Ability to respond to opportunities within minutes, not days
- Real-time pattern recognition and anomaly detection
- Immediate visibility into operational changes
I’ve watched companies transform their competitive position through what I call “decision speed advantage.” When Best Buy connected employee engagement data with store revenue through visualization, they discovered that a 0.1% increase in engagement translates to $100,000 annual operating income per store. But here’s the key: they could see these patterns in real-time and act immediately, not wait for quarterly reports.
Simplifying complex datasets democratizes data across your organization. I often tell clients that the human brain processes visuals 60,000 times faster than text, which means the right visualization can convey insights that would take hours to explain in traditional reports.
This accessibility enables:
- Non-technical stakeholders to contribute insights
- Faster pattern recognition across all skill levels
- Reduced training requirements for data interpretation
- Improved communication between technical and business teams
Aligning teams and strategies through shared visual understanding eliminates the conflicting data interpretations that plague many organizations. When sales, marketing, operations, and leadership teams view the same real-time metrics, they coordinate efforts more effectively and respond to challenges with unified strategies.
The measurable impact demonstrates why the benefits of data visualization are so compelling: organizations implementing strategic visualization report 28% faster decision-making and are 70% more likely to make data-driven choices. But based on my experience with data visualization service providers, these benefits only materialize when implementation addresses your specific business processes, not when you deploy generic dashboards.
According to Gartner’s 2024 analysis of data and analytics trends, organizations that fail to effectively leverage data analytics will struggle to remain competitive in today’s market.
6 Key Benefits of Partnering with a Data Visualization Consultant
Through implementations I’ve guided across industries, these six benefits consistently deliver the highest impact when partnering with data visualization consultant expertise.
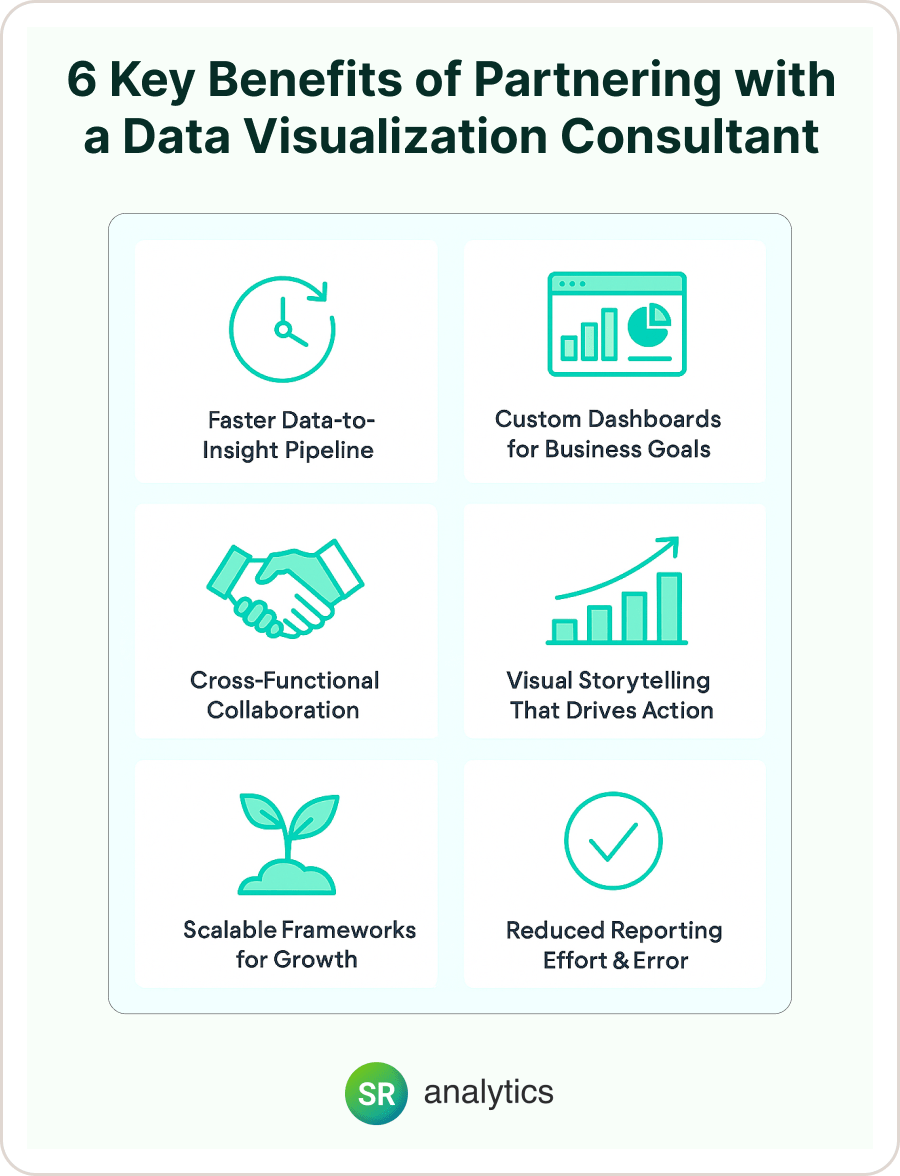
1. Faster Data-to-Insight Pipeline
I’ve seen the dramatic difference between internal teams struggling for months to build their first dashboard versus experienced consultants delivering production-ready solutions in weeks. Professional consultants achieve 50% faster implementation through proven methodologies, template libraries, and deep platform expertise that eliminates trial-and-error delays.
The speed advantage compounds as consultants optimize data preparation processes, automate reporting workflows, and establish frameworks that accelerate future projects. Organizations typically experience:
- 50% reduction in reporting time within first year
- 55% increase in operational efficiency
- Elimination of manual data compilation tasks
- Automated exception reporting and alerting systems
Research shows that businesses implementing BI solutions can achieve a 127% return on investment within three years, making the speed advantage even more valuable.
2. Custom Dashboards Tailored to Business Goals
Generic dashboard templates rarely deliver business value because they don’t align with specific decision-making processes. I always start consulting engagements by understanding business workflows before designing any visualizations.
Credit Suisse exemplifies the benefits of data visualization when working with skilled data visualization experts—their custom employee retention analytics identified specific risk factors like team dynamics and commute patterns, delivering $70 million annual savings. This customization demonstrates why understanding what is a data visualization consultant matters: they ensure maximum ROI through solutions perfectly aligned with operational reality rather than forcing businesses to adapt to generic dashboards.
The difference between custom and generic approaches highlights the role of data visualization in strategic business transformation. Custom solutions focus on the specific metrics that drive your business forward, integrate with your existing processes, and provide insights that directly support your strategic objectives.
3. Cross-Functional Collaboration Through Clarity
When I work with organizations on our comprehensive data analytics consulting services, I often discover different departments making decisions based on conflicting data interpretations. Proper visualization solutions create shared understanding that transforms organizational dynamics.
Interactive dashboards enable a 52% increase in stakeholder engagement because teams can see how their actions impact overall performance. This collaboration demonstrates the benefits of data visualization in breaking down silos and transforms meetings from arguing about data meaning to discussing actions based on clear insights.
The transformation I see is remarkable when data visualization experts properly implement cross-functional solutions. Instead of meetings focused on explaining spreadsheets and reconciling conflicting reports, teams concentrate on identifying opportunities, coordinating responses, and making informed decisions quickly.
4. Visual Storytelling That Drives Action
The consultants I respect most understand that effective visualization creates compelling narratives that influence decision-making. They combine design principles with business understanding to create presentations that resonate with both executives and operational staff.
What skilled data visualization experts deliver:
- Highlight 3-5 key insights requiring immediate attention instead of overwhelming stakeholders with dozens of metrics
- Provide context that enables confident decision-making at all organizational levels
- Transform static reports into strategic communication tools through compelling narratives
- Create clear, actionable insights directly relevant to strategic decisions
This storytelling capability demonstrates the role of data visualization in driving organizational change. I’ve watched executive teams go from avoiding data presentations to actively requesting them because the insights are clear, actionable, and directly relevant to their strategic decisions. This transformation shows the true benefits of data visualization when implemented by experienced professionals.
5. Scalable Frameworks for Future Growth
I’ve seen too many organizations outgrow their initial visualization setup within 18-24 months, requiring expensive reimplementation. Quality data visualization service providers build solutions that accommodate expanding user bases, additional data sources, and evolving business requirements from day one.
This architectural foresight prevents the common problem where visualization systems become bottlenecks rather than enablers as organizations grow. Proper upfront design by experienced data visualization experts delivers immediate value while supporting future needs without requiring complete platform overhauls.
The scalability considerations include data architecture that handles volume growth, user management systems supporting organizational expansion, and integration capabilities for additional data sources as your business evolves. This demonstrates the role of data visualization in long-term strategic planning.
6. Reduced Reporting Effort and Human Error
Organizations typically experience 70-80% reduction in manual reporting effort after partnering with data visualization consultant professionals. The automation capabilities they build eliminate repetitive tasks, freeing teams to focus on analysis and strategic thinking rather than data compilation.
Key improvements organizations achieve:
- Eliminate manual data compilation tasks that consume valuable time
- Reduce costly mistakes from manual reporting that can lead to wrong decisions
- Ensure consistent, timely reporting through automated validation systems
- Transform team focus from 60% data compilation to 60% analysis and insights generation
- Create significant competitive advantages through faster decision-making capabilities
- Dramatically improve job satisfaction for analytical teams
The error reduction is equally significant and showcases another of the key benefits of data visualization. Automated visualization systems with proper data validation eliminate risks while ensuring reliable reporting processes.
This shift highlights why data visualization experts are so valuable—they don’t just create better charts, they fundamentally transform how organizations work with data to drive strategic outcomes.
How Data Visualization Experts Add Value
The unique value data visualization experts deliver comes from combining skills most organizations struggle to develop internally. This expertise directly impacts the benefits of data visualization your organization can achieve and explains why data visualization service providers often outperform internal teams.
I’ve seen too many internal attempts that excel in one area while failing in others—technically solid dashboards nobody wants to use, beautiful visualizations that don’t support decision-making, or business-focused reports that perform poorly with real data volumes. The blend of design, tech, and business acumen creates solutions that are simultaneously compelling, robust, and strategically aligned.
Harvard Business Review research on data visualization emphasizes that good visualization can communicate the nature and potential impact of ideas more powerfully than any other form of communication.
Industry-specific KPI knowledge accelerates implementation and ensures you’re tracking metrics that actually drive performance. This specialized knowledge includes:
- Retail: Customer lifetime value, inventory turnover, conversion funnels
- Manufacturing: Equipment effectiveness, IoT sensor data, predictive maintenance
- Healthcare: Patient outcomes, HIPAA compliance, clinical workflows
- Financial Services: Risk metrics, regulatory reporting, fraud detection
Fortune Business Insights reports that the global business intelligence market is projected to grow from $34.82 billion in 2025 to $63.20 billion by 2032, driven largely by industry-specific implementation expertise.
Proven experience with visual storytelling for multiple organizational levels means your investment delivers value across the company. Executive dashboards need different design approaches than operational reporting, and experienced data visualization experts create coherent visualization ecosystems serving multiple audiences effectively.
The external perspective I bring often reveals optimization opportunities that internal teams miss due to process familiarity. Fresh eyes on entrenched workflows frequently identify unexpected insights and improvement opportunities generating significant competitive advantages. This external viewpoint is one of the key benefits of data visualization consulting that organizations often underestimate.
Choosing the Right Data Visualization Service Providers
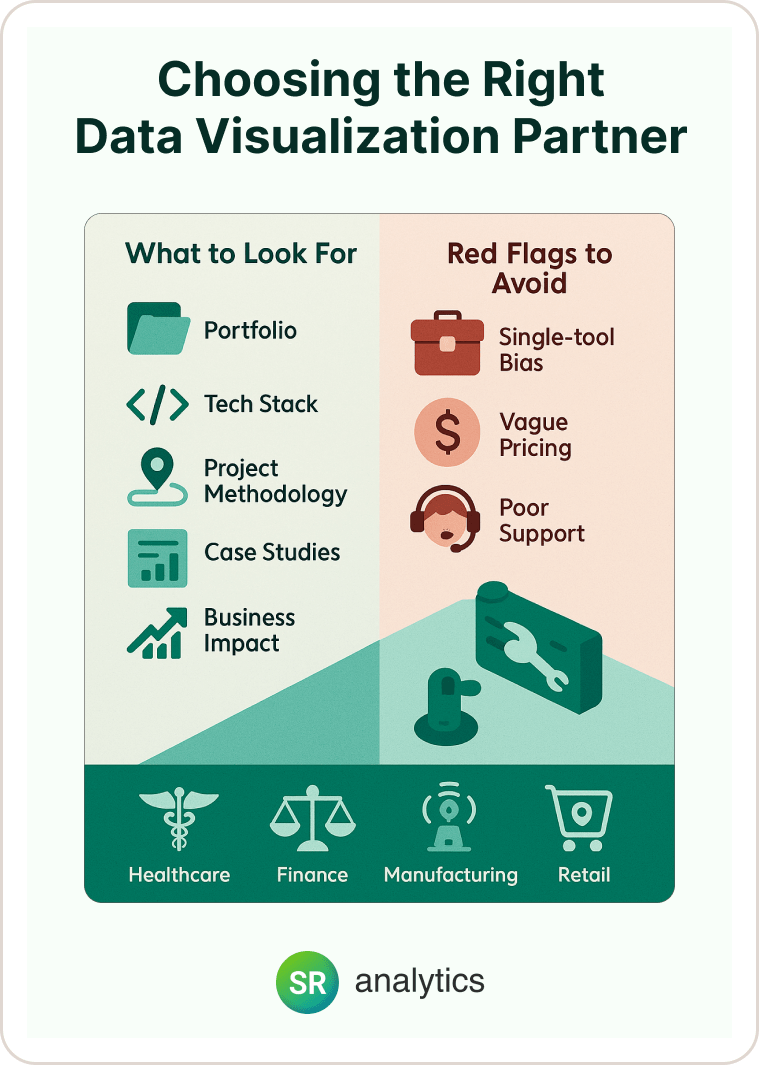
Selecting quality data visualization service providers requires evaluation across multiple dimensions beyond technical capabilities. The role of data visualization in your business strategy depends heavily on choosing partners who understand both the benefits of data visualization and your specific industry challenges.
What to evaluate: portfolio, tech stack, consulting process should focus on relevant experience rather than impressive client names. Look for:
- Case studies from organizations similar in size, industry, and data complexity
- Demonstrated results with measurable business impact
- Clear project methodology and milestone definitions
- Multi-platform expertise rather than single-tool focus
I recommend evaluating their project methodology carefully. Quality providers ask detailed questions about current data architecture, decision-making processes, and business objectives before recommending specific tools. They should demonstrate understanding of your industry’s unique challenges and regulatory requirements.
Red flags to avoid include:
- Single-tool focus regardless of requirements
- Vague pricing with hidden fees or unclear scope
- Limited relevant case studies or client references
- Poor communication during initial discussions
- Overpromising capabilities without understanding your data landscape
- Inadequate post-implementation support plans
Why domain understanding is as important as tech skills became clear early in my career watching technically excellent implementations fail because they didn’t address industry-specific requirements. The role of data visualization varies significantly by industry, and data visualization service providers must understand these nuances to deliver the full benefits of data visualization:
- Healthcare needs HIPAA compliance expertise and clinical workflow understanding
- Financial services require regulatory knowledge and risk management frameworks
- Manufacturing consultants should understand IoT sensor data and equipment monitoring
- Retail experts must grasp customer journey mapping and inventory optimization
For organizations considering broader technology changes, understanding how business intelligence strategy integrates with visualization solutions helps evaluate overall technology transformation needs.
Conclusion
The benefits of data visualization represent strategic capabilities that separate thriving organizations from those struggling in today’s data-driven marketplace. Based on my experience with data visualization service providers and understanding what is a data visualization consultant brings to organizations, companies achieve results ranging from $8 million to $70 million in annual benefits through strategic implementations.
With 91% of SMBs using AI reporting revenue boosts and the visualization market growing at 10.95% CAGR, the role of data visualization in competitive advantage is clear. The question isn’t whether to invest—it’s how quickly you can implement solutions that transform decision-making capabilities through partnering with data visualization consultant expertise.
Recent analysis of business intelligence trends for 2025 confirms that organizations are prioritizing data visualization as a critical component of their digital transformation strategies.
Ready to unlock the full benefits of data visualization? At SR Analytics, I’ve helped organizations across healthcare, finance, manufacturing, and retail transform their analytics through strategic consulting with experienced data visualization experts. Our Data Visualization Services deliver rapid implementation, strong user adoption, and measurable results that justify your investment.