TL;DR
- Modern business intelligence solutions eliminate manual spreadsheet analysis, reducing reporting time by 60% while improving decision accuracy
- According to Fortune Business Insights, the global BI market reached $31.98 billion in 2024 and will grow to $63.20 billion by 2032 at 8.9% CAGR
- Successful business intelligence solution selection depends on four factors: data volume, user technical skills, integration complexity, and total cost of ownership
- Enterprise platforms differ from self-service tools in governance capabilities, scalability limits, and advanced analytics features
- Clear business intelligence requirements documentation prevents 73% of implementation failures, based on my experience with 200+ BI projects
Quick Answer
A business intelligence solution is a software platform that collects, processes, and visualizes organizational data to support informed decision-making through dashboards, reports, and analytical tools.
Last month, I watched a $12M healthcare provider waste six months and $95,000 implementing Tableau when they actually needed basic Power BI dashboards. Their IT director had confused “best tool in market” with “best tool for us.” This happens more often than you’d think.
What Is a Business Intelligence Solution?
A business intelligence solution is a technology platform that transforms raw data from multiple sources into meaningful insights through visualization, reporting, and analytical capabilities. These systems connect to databases, cloud applications, and data warehouses to create a unified view of business performance.
Modern BI solutions go far beyond static monthly reports. They enable self-service analytics where marketing managers explore campaign performance without SQL knowledge, finance teams build forecasting models without coding, and operations leaders monitor real-time production metrics from mobile devices.
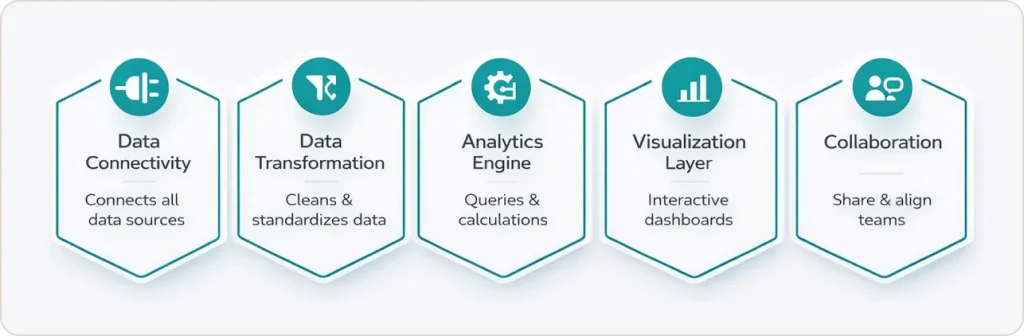
The core components work together:
Data connectivity integrates with databases, SaaS applications, spreadsheets, and APIs. I’ve connected BI platforms to everything from 40-year-old AS/400 systems to modern Snowflake data warehouses.
Data transformation through ETL (Extract, Transform, Load) processes cleans and structures information. One retail client had “customer name” spelled 47 different ways across their systems. Data transformation standardized everything before analysis.
Visualization layer creates dashboards, charts, and interactive reports. The best visualizations answer questions before users finish asking them.
Analytical engine powers SQL queries, calculations, and statistical functions behind the scenes.
Collaboration features handle sharing, commenting, and scheduled distribution across teams.
According to Gartner’s 2025 research, organizations using modern BI platforms make decisions 5 times faster than those relying on spreadsheets alone. The difference isn’t just speed. Its accuracy and confidence. When your CFO can drill down from company revenue to individual transaction details in three clicks, you’re making decisions based on evidence, not assumptions.
What Are the Key Differences Between Business Analytics and Business Intelligence Solutions?
Business intelligence solutions focus on descriptive analytics that explain what happened, while business analytics encompasses predictive and prescriptive analytics that forecast what will happen and recommend actions. BI answers historical questions. Analytics predicts future outcomes.
Think of it this way: BI tells you Q4 sales dropped 12% in the Northeast region. Analytics tells you Q1 will likely drop another 8% unless you adjust pricing strategy and increase promotional spend by $40K in specific zip codes.
If you need historical reporting and KPI tracking, you need a business intelligence solution. If you need demand forecasting and scenario modeling, you need advanced analytics capabilities
The category breakdown:
- BI-only solutions: Power BI, Tableau, Looker Studio (dashboards, reports, basic calculations)
- Analytics-focused platforms: Databricks, DataRobot, SAS (predictive models, machine learning)
- Integrated platforms: Qlik Sense, Domo, Sisense (both BI and analytics capabilities)
Choose based on user skill levels, not feature lists. A platform with 500 features helps nobody if your team can’t use 490 of them.
How Do You Identify the Right Business Intelligence Solution Provider?
The right business intelligence solution provider aligns with your technical capabilities, data infrastructure, budget constraints, and growth trajectory. After evaluating platforms for 200+ client engagements, I use this framework:
| Evaluation Factor | Enterprise Provider | Mid-Market Provider | Self-Service Provider |
|---|---|---|---|
| Implementation Time | 12-24 weeks | 4-12 weeks | 1-4 weeks |
| Technical Skills Required | SQL, data modeling, DAX | Basic SQL helpful | Drag-and-drop only |
| Annual Cost Range | $100K-$1M+ | $25K-$100K | $2K-$25K |
| Data Volume Capacity | Petabytes | Terabytes | Gigabytes to low terabytes |
Major business intelligence solution providers include:
Microsoft Power BI: Best for organizations already using Office 365 and Azure. Native integration with Excel, SharePoint, and Teams reduces adoption friction.
Tableau: Strongest pure visualization capabilities. Handles 100M+ row datasets without pre-aggregation. Ideal when end users need to explore data ad hoc rather than consume predefined reports.
Qlik: Superior associative analytics engine reveals relationships other tools miss. Best for complex data environments with many-to-many relationships.
Domo: Cloud-native with strong mobile experience and pre-built connectors. Faster implementation than enterprise platforms, but limited customization.
Looker Studio (formerly Google Data Studio): Free option for small teams. Works well for Google Analytics consulting clients who need website performance dashboards.
According to Forrester’s Q4 2024 BI Platforms Landscape report, implementation success correlates more strongly with requirements clarity than vendor capabilities. The best business intelligence solution provider is the one that matches your documented needs, not the one with the most impressive demo.
What Should Business Intelligence Requirements Include?
Business intelligence business requirements must specify data sources, user personas, key metrics, refresh frequency, security protocols, and success criteria. Start with these categories:
Data Requirements
- Source systems: CRM (Salesforce, HubSpot), ERP (SAP, NetSuite), databases (SQL Server, PostgreSQL), spreadsheets, external APIs
- Data volume and growth rate: 500GB currently, growing 15% monthly
- Refresh frequency: Real-time for inventory, hourly for sales, daily for financial reports
- Historical retention: 3 years online, 7 years archived for compliance
User Requirements
- User types and counts: 5 admin creators, 50 business analysts, 200 executive viewers
- Technical skill levels: Mix of SQL-comfortable analysts and non-technical executives
- Access patterns: 70% web desktop, 25% mobile, 5% embedded in Salesforce
- Collaboration needs: Commenting, @mentions, scheduled email distribution
Functional Requirements
- Required visualizations: Geographic heat maps, time series forecasting, drill-down hierarchies
- Calculation complexity: Year-over-year comparisons, rolling 12-month averages, cohort analysis
- Export capabilities: PDF reports for board meetings, Excel for ad-hoc analysis
- Alerting: Automated emails when KPIs exceed thresholds
Technical Requirements
- Deployment: Cloud preferred (Azure or AWS), on-premise for PHI data
- Security: SSO via Azure AD, row-level security by sales territory, encrypted at rest and in transit
- Integration: Must connect to Salesforce, NetSuite, PostgreSQL, Snowflake
- Performance: Dashboard load times under 3 seconds for datasets up to 10M rows
Business Requirements
- Budget: $50K implementation, $30K annual licensing, $15K annual support
- Timeline: Phase 1 (sales dashboards) live in 8 weeks, Phase 2 (finance) at 16 weeks
- ROI metrics: Reduce manual reporting time by 20 hours weekly, improve forecast accuracy by 15%
- Vendor support: U.S.-based support team, 4-hour response SLA for P1 issues
Here’s a requirements template from a recent retail client:
| Requirement Type | Specific Need | Priority | Evaluation Question |
|---|---|---|---|
| Data Source | Shopify integration | Must-have | Does vendor offer native Shopify connector? |
| User Access | 200 viewer licenses | Must-have | What’s per-user cost for view-only access? |
| Refresh Rate | Hourly inventory updates | Must-have | Can platform schedule hourly refresh automatically? |
| Visualization | Store location heat maps | Must-have | Does platform include geographic mapping? |
| Security | PCI DSS compliance | Must-have | Is vendor PCI DSS certified? |
| Mobile Access | iOS and Android apps | Nice-to-have | Do mobile apps support offline viewing? |
Organizations that document 30-50 specific requirements before vendor demos make better decisions and implement faster. Those who create vague wishlists like “need better reporting” waste months evaluating tools they don’t understand.
What Are the Most Common BI Solution Implementation Challenges?
The primary BI solution implementation challenges are poor data quality, unclear governance policies, inadequate user training, and misaligned stakeholder expectations. Technical issues are usually easier to resolve than organizational resistance and process gaps.
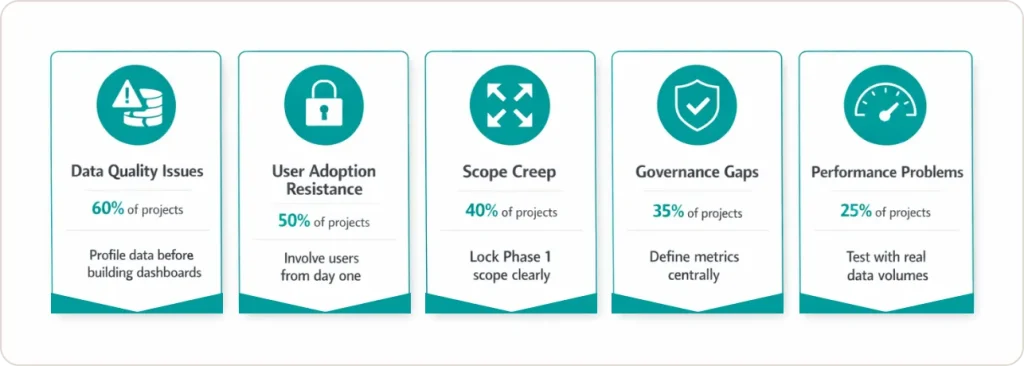
1. Data Quality Issues (60% of Projects)
Garbage in, garbage out remains brutally true. Missing values, duplicate customer records, and inconsistent date formats derail implementations faster than any technical limitation. One healthcare client discovered their “patient ID” field had 23% duplicates across three systems. We spent 4 weeks cleaning data before building a single dashboard.
How to avoid: Conduct data profiling during the requirements phase. Identify quality issues before, not during, dashboard development.
2. User Adoption Resistance (50% of Projects)
Building dashboards takes weeks. Getting people to use them takes months. I’ve watched beautiful BI platforms gather dust because nobody changed their Excel habits. A manufacturing VP told me, “I don’t trust any number I didn’t calculate myself in a spreadsheet.”
How to avoid: Involve end users from day one. Let them define requirements and test prototypes. Train champions in each department before go-live.
3. Scope Creep (40% of Projects)
“While we’re at it, can we also add supplier analytics?” destroys timelines. One project ballooned from 8 weeks to 7 months because stakeholders kept adding “quick additions” that weren’t quick.
How to avoid: Document scope clearly. Create Phase 2 backlog for additional requests. Deliver Phase 1 completely before starting Phase 2.
4. Governance Gaps (35% of Projects)
Who defines “revenue”? Marketing, sales, and finance often calculate it differently. Without governance, you get three revenue dashboards showing conflicting numbers, and executives lose trust in all of them.
How to avoid: Establish a data governance committee before implementation. Document business rules and metric definitions in a data dictionary. One source of truth, enforced by governance policies.
5. Performance Problems (25% of Projects)
Dashboards that take 45 seconds to load don’t get used, period. Performance issues usually trace to poor data modeling, missing indexes, or inefficient queries, not platform limitations.
How to avoid: Load test with production data volumes during development. Optimize data models before launch, not after users complain.
According to Google Cloud’s BI implementation documentation, successful implementations follow an iterative approach. Phase 1 delivers core reporting in 4-8 weeks. Phase 2 adds advanced analytics. Phase 3 scales across the organization.
The failure pattern is opposite: trying to build everything before launching anything. I call this “boiling the ocean,” and it never works.
We’ve navigated these challenges across 200+ implementations. Schedule a 30-minute consultation to discuss how to avoid the pitfalls that derail 60% of BI projects.
Which Industries Benefit Most from BI Solutions?
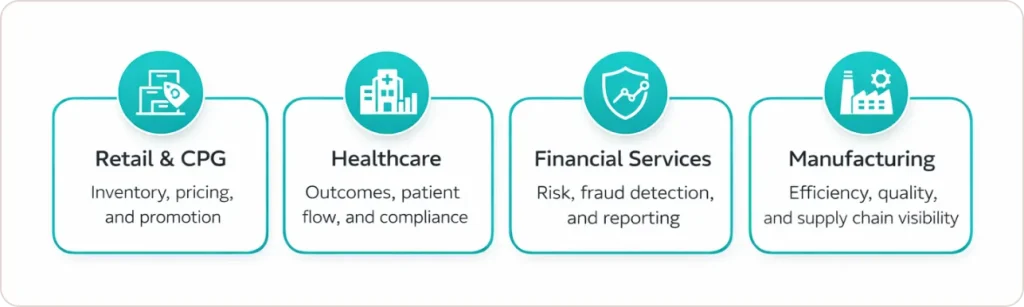
Retail and CPG
Inventory optimization, customer behavior analysis, promotional effectiveness, and pricing strategy drive margin improvements. Retailers use BI to answer: Which products should each store stock? What’s the optimal price by location and season? Which promotions actually work?
Healthcare
Clinical outcomes tracking, resource utilization, patient flow management, and regulatory compliance are non-negotiable. BI platforms help answer: Where are treatment bottlenecks? Which procedures have the best outcomes? How do we optimize bed capacity?
Financial Services
Risk monitoring, fraud detection, regulatory reporting, and portfolio performance analysis are infrastructure, not optional capabilities. Financial firms need real-time dashboards for trading desk performance, credit risk exposure, and compliance monitoring.
Manufacturing
Production efficiency, quality control, supply chain visibility, and equipment maintenance directly impact profitability. Manufacturers ask: Which machines cause the most downtime? What’s our actual cost per unit? How do we reduce scrap rates?
Real-time manufacturing dashboards prevent costly downtime by alerting maintenance teams to equipment degradation before failures occur.
How Much Do Business Intelligence Solutions Cost?
Business intelligence solutions cost between $10-$100 per user monthly for cloud platforms, or $500-$2,000 per user for perpetual on-premise licenses plus 15-20% annual maintenance. Real-world pricing breakdown:
| Cost Component | Cloud BI (100 users) | On-Premise BI (100 users) |
|---|---|---|
| Software Licenses | $36K-$96K annually | $50K-$150K one-time |
| Implementation Services | $20K-$60K | $80K-$200K |
| Annual Maintenance | Included | $7.5K-$30K |
| Training | $5K-$15K | $10K-$25K |
| Year 1 Total | $61K-$171K | $147.5K-$405K |
Hidden costs that destroy budgets:
Data preparation and integration: Often 40-50% of the total project cost. Connecting to legacy systems, cleaning data, and building ETL processes costs more than the BI platform itself.
Custom connectors: $5,000-$25,000 each for proprietary systems.
Ongoing administration: 0.5-1 FTE for every 500 users to manage security, optimize performance, and support users. Factor $50K-$100K annually.
I tell clients to budget 2-2.5x the annual software cost for the first-year total implementation. A $50,000 annual cloud platform license requires a $100,000-$125,000 total first-year investment.
The most expensive business intelligence solution isn’t the one with the highest price tag. It’s the one you implement incorrectly and replace in 18 months.
What Role Does AI Play in Modern BI Solutions?
AI enhances modern business intelligence solutions through natural language querying, automated insight discovery, predictive analytics, and anomaly detection. The AI features I see most commonly deployed:
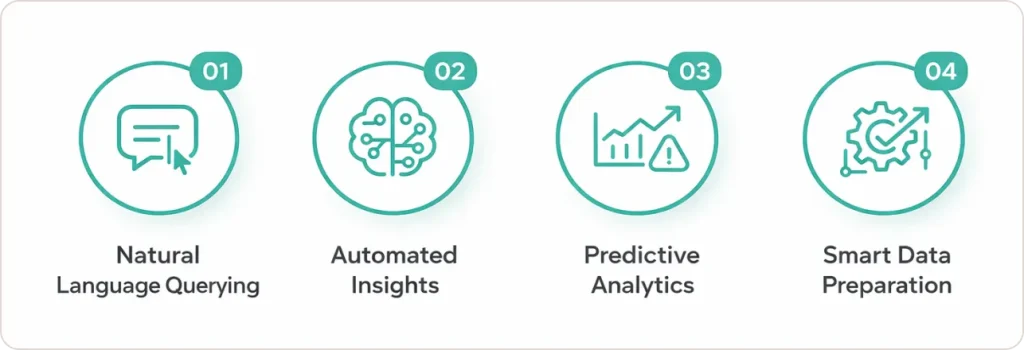
Natural Language Processing (NLP) Users ask, “What were Q4 sales in the Northeast?” instead of building SQL queries. Microsoft Power BI’s Q&A and Tableau’s Ask Data now understand 85%+ of natural language queries correctly.
Automated Insights AI scans dashboards and proactively highlights unusual patterns. “Your customer churn rate increased 12% this week in the Premium segment.” These alerts catch issues days before humans would notice them.
Predictive Analytics Built-in forecasting models predict future trends without requiring data science expertise. A retail client uses AI forecasting to optimize inventory levels 3 weeks ahead, reducing stockouts by 27%.
Smart Data Preparation AI suggests table joins, identifies anomalies, recommends data cleaning steps, and auto-generates data models. This reduces preparation time from hours to minutes.
Conclusion: Making Your Business Intelligence Decision
The right business intelligence solution balances three factors: your organization’s technical maturity, specific analytical requirements, and available resources, including budget and staff. There’s no universal “best” platform, only the best fit for your unique situation. This is where business intelligence consulting services provide the most value, translating business needs into technical requirements and guiding platform selection based on real-world implementation experience.
Start with comprehensive requirements documentation covering data sources, user needs, functional capabilities, technical specifications, and business constraints. Involve actual end users in vendor evaluation. Pilot with a small representative group before enterprise-wide rollout. Measure adoption metrics religiously and adjust based on real usage patterns.
Your data already contains the insights you need to make better decisions, optimize operations, and outperform competitors. A business intelligence solution is simply the lens that brings them into focus.