Key Highlights:
- CPG brands using data analytics achieve 69% higher revenue and 72% cost reductions versus those relying on gut decisions
- Unilever prevented $800K in lost sales by predicting heat waves two weeks out, while competitors faced empty shelves
- 23x customer acquisition advantage for CPG companies leveraging consumer analytics versus traditional approaches
- 90-day implementation delivers measurable ROI, transforming promotional waste into profit and reactive planning into proactive advantage
The $200K Promotion That Was Actually Losing Money
“We’ve been running the same July 4th promotion for eight years. It works every time, right?” The VP of Sales sat across from me, confident. His beverage company had hit their numbers. The promotion looked successful on every report.
Then we analyzed the data.
That “successful” promotion was losing $200K annually through margin erosion and baseline cannibalization. Worse, they were promoting heavily in June when demand naturally spiked anyway. Analytics showed July-August promotions delivered 3x better incremental lift.
This wasn’t an isolated mistake. Across the CPG industry, brands are hemorrhaging millions because they’re making billion-dollar decisions with incomplete information.
Here’s what keeps executives up at night in 2025: Your customer who bought exclusively in-store now purchases across five channels. Private labels use the same advanced analytics you should be using. Retail media networks hit $62 billion in spending, according to eMarketer research, creating unprecedented targeting capabilities.
Meanwhile, Deloitte’s 2024 CPG Industry Outlook confirms 76% of businesses report significant shipment delays affecting customer satisfaction. The brands dominating shelf space aren’t the biggest. They’re the fastest at turning data into action.
Quick Answer:
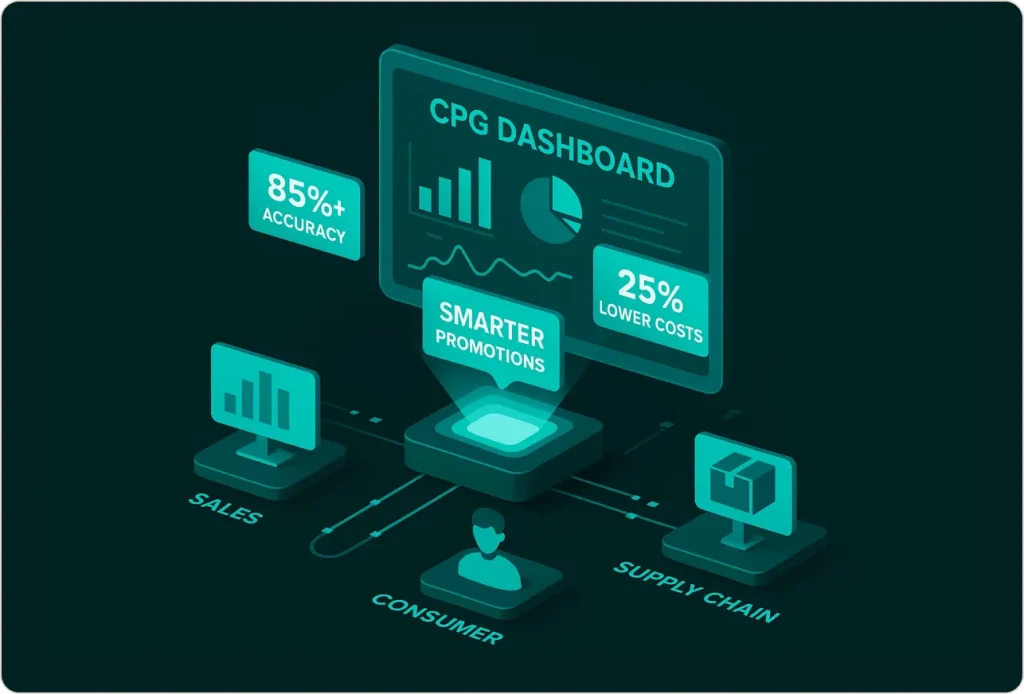
CPG data analytics transforms sales, consumer, and supply chain data into actionable insights. Leading brands achieve 85%+ forecast accuracy, reduce costs by 15-25%, and optimize promotions previously destroying margins.
What CPG Data Analytics Actually Means (No Jargon)
Let me cut through the buzzwords.
CPG data analytics is the process of collecting, analyzing, and interpreting data from across your entire value chain, from manufacturing floors to retail shelves to consumer repurchase behavior.
The goal? Generate insights that drive smarter business decisions.
Every product moving off a shelf generates data. Every promotional campaign creates a digital footprint. Every supply chain decision leaves a trail.
Consumer packaged goods analytics connects these dots to answer questions that determine whether you gain or lose market share:
- Where are my products selling best, and more importantly, why?
- Which promotions drive real incremental sales versus just shifting purchases forward?
- How can I predict demand spikes before competitors even see them coming?
- What emerging consumer trends should I bet my innovation budget on?
- Where are hidden supply chain inefficiencies bleeding my margins?
Here’s why CPG data analytics differs from general retail analytics: it focuses on the manufacturer’s lens across the entire journey from production planning to consumer loyalty, not just register transactions.
This distinction matters. While retailers optimize store performance, consumer packaged goods analytics optimizes brand performance across all channels and touchpoints.
The Evolution Nobody Talks About
Procter & Gamble pioneered data-driven decisions in the 1930s with door-to-door consumer surveys.
2025 represents a quantum leap.
McKinsey’s research on AI in consumer goods reveals we’ve moved from monthly Excel reports to real-time AI systems predicting demand based on weather patterns, social media trends, and competitive movements simultaneously.
The brands winning today don’t just collect data. They act on it in real-time.
Why September 2025 Is Your Last Chance to Catch Up
71% of CPG leaders adopted AI-powered analytics in 2024, up from 42% in 2023.
Those who implemented it properly? 69% revenue growth.
These aren’t just numbers. They represent the CPG industry trends 2025 is accelerating: the gap between analytics leaders and laggards widening exponentially.
But here’s the brutal truth: every quarter you wait, your competitors pull further ahead with sharper CPG insights.
The Perfect Storm Hitting Every CPG Brand
Consumer Behavior Fragmentation: Your customer shops five different channels. Without unified analytics, you’re flying blind.
Retail Media Network Explosion: $62 billion in 2025 spending creates unprecedented shopper behavior data. Your competitors are already leveraging it for targeting.
Private Label Sophistication: Store brands now use advanced consumer packaged goods analytics. To compete, your CPG insights need to be sharper and faster.
Supply Chain Volatility: Factory closures trigger demand shifts within 48 hours. Traditional planning models can’t adapt, but predictive CPG data analytics can.
What Separates Winners From Losers
A regional snack brand discovered their “star product” wasn’t their most profitable. Analytics revealed a lower-volume SKU had 40% better margins and faster velocity.
That insight redirected $2M in marketing spend.
A cosmetics company in LATAM reduced inventory handling costs by 23% through supply chain analytics. BCG research confirms organizations using data analytics achieve 12% output increases and 5-6% cost reductions.
That’s not incremental improvement. That’s market dominance.
“The CPG companies that will thrive in the next decade are those that view analytics as a strategic capability, not just a reporting function. Data-driven decision-making is no longer optional.” – Tom Davenport, Distinguished Professor at Babson College (Harvard Business Review)
5 Ways Top CPG Brands Turn Data Into $10M+ Revenue Lifts
1. CPG Marketing Analytics That Actually Converts
One beverage client increased marketing ROI by 40% by targeting their top three consumer segments differently.
Generic “spray and pray” campaigns died. Precision targeting won.
CPG marketing analytics transforms campaigns by understanding how to predict customer behavior through advanced segmentation. This isn’t just better targeting, it’s fundamentally different decision-making.
Real-World Win: Nestlé’s personalized e-commerce campaigns drove 9.2% digital channel growth by recommending products based on individual purchase history. This exemplifies how CPG marketing analytics delivers measurable outcomes, not just better reports (Source).
2. Promotions That Stop Destroying Margin
We helped a snack brand discover 35% of their trade promotions destroyed margin without driving meaningful volume.
The fix? Promotional lift analysis measuring true incrementality, a core capability of effective CPG data analytics.
If you sell 100 units at full price normally and 150 during a promotion, your lift isn’t 50%. You need to subtract the baseline to get true incrementality.
That food manufacturer with the July 4th problem? They redirected $1.2M in promotional waste to higher-ROI tactics.
3. Demand Forecasting That Prevents Stockouts
Modern CPG data analytics systems predict demand at SKU-level with 85%+ accuracy by incorporating weather, social trends, and competitive movements.
That beverage company prevented $800K in lost sales by predicting a heat wave and pre-positioning inventory two weeks out.
AI-powered demand forecasting has become the most mature application in consumer packaged goods analytics, with leading brands achieving 10-15% forecast accuracy improvements.
P&G improved forecast accuracy by 10% and reduced stockouts while simultaneously cutting excess inventory, contributing to 30% operational efficiency gains.
4. Inventory Optimization That Frees Cash
Leading brands achieve 15-25% reductions in inventory carrying costs through predictive CPG data analytics.
One cosmetics company reduced inventory handling costs by 23% through distribution network optimization driven by supply chain analytics.
The balance? Cost of holding inventory versus stockout risks. Getting this right transforms working capital management.
5. Retail Execution That Captures Every Sale
Real-time void analysis prevents chronic out-of-stocks.
Every stockout is a sale you’ll never recover. This is where CPG insights translate directly into revenue capture or revenue loss.
Consumer packaged goods analytics creates a continuous improvement cycle: insights drive planning, planning drives action, action generates new data, which creates better insights.
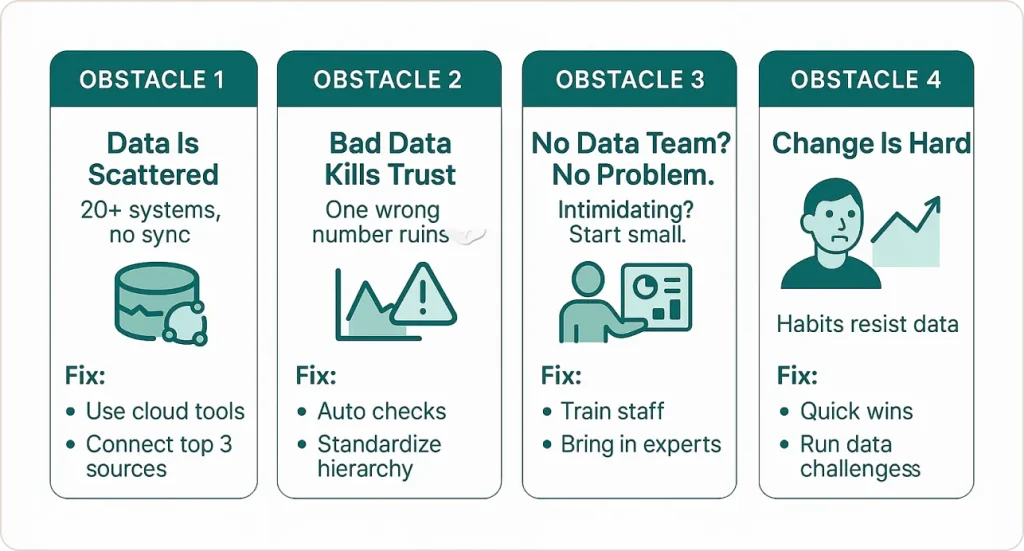
The 4 Obstacles Killing Your CPG Data Analytics (And How to Beat Them)
Obstacle 1: Data Scattered Across 20+ Systems
Your POS data lives in retailer portals. Shipment data in your ERP. Consumer data in your CRM.
Nothing talks to each other. This fragmentation kills CPG insights before they can drive decisions.
Companies waste 20+ hours weekly manually pulling data into Excel spreadsheets. That’s an expensive full-time employee doing copy-paste work.
The Fix: Cloud-based solutions like Snowflake or Google BigQuery offer free tiers handling most SMB needs.
Start by integrating your top 3 data sources impacting your most critical KPI. Build from there.
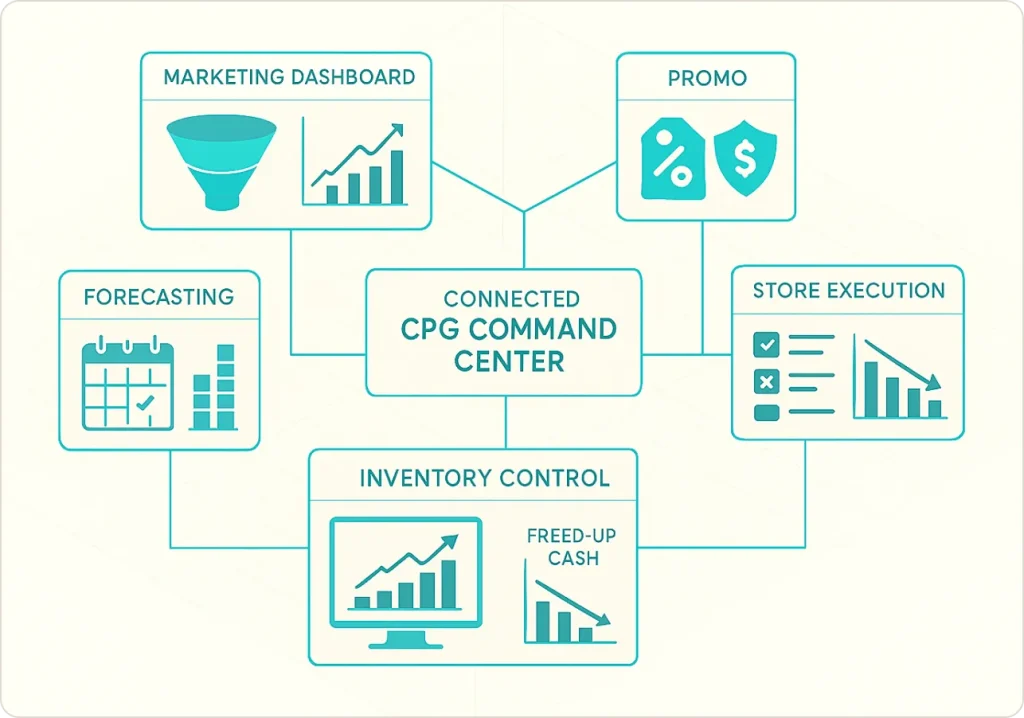
Implementing comprehensive business intelligence solutions breaks down these silos and creates unified dashboards connecting retail POS data, shipment information, and consumer insights. This infrastructure enables true CPG data analytics, not just disconnected reporting.
Obstacle 2: Data Quality Destroying Trust
Poor data quality costs companies $12.9 million annually, according to Gartner research.
More critically? It destroys confidence.
When executives see wrong numbers once, they stop trusting all numbers.
The Fix: Implement automated quality checks, standardize product hierarchies, and create clear ownership.
Many CPG brands face common data analytics challenges around data quality and governance. Addressing these systematically prevents expensive mistakes and ensures your CPG insights drive accurate decisions.
Obstacle 3: Lack of Analytics Talent
Not every CPG brand has data scientists on staff. Your team knows consumer packaged goods, but advanced analytics may seem intimidating.
The Fix: You have three options:
Train existing team members: Modern BI tools like Power BI dramatically lowered technical barriers. Your sharp marketing analyst can learn to build dashboards that deliver real CPG insights.
Start simple and scale: You don’t need AI on day one. Begin with descriptive analytics (what happened) and diagnostic analytics (why it happened). Build toward predictive CPG data analytics as capabilities mature.
Partner with specialists: Analytics consulting accelerates implementation and helps you avoid expensive mistakes that derail CPG industry trends 2025 adoption.
Obstacle 4: Change Management (The Hardest One)
The VP who’s been in CPG for 25 years doesn’t want an “algorithm” telling them how to run promotions.
Brilliant analytics implementations fail because teams keep making decisions the old way.
The Fix: Start with quick wins. Pick one decision where data can clearly improve outcomes.
Prove it. Build credibility.
One client ran a “data challenge” with teams competing to find the best insight from their new analytics platform. Made it fun, created engagement, demonstrated value.
Your 90-Day Roadmap to $2M+ in Captured Value
Month 1: Foundation
Weeks 1-2: Identify your biggest pain point. Choose 2-3 KPIs that address it directly. Set specific targets like “Improve forecast accuracy from 70% to 80%.”
Weeks 3-4: Inventory current data sources. Integrate the 3-5 most critical ones. Create your first dashboard.
Success Milestone: Working dashboard tracking 2-3 KPIs, updated weekly.
Month 2: Build and Optimize
Weeks 5-6: Automate data pulls. Implement quality checks. Build analytics data model.
Weeks 7-8: Start predictive modeling. Train your team. Run parallel testing comparing analytics-driven decisions to traditional approaches.
Success Milestone: Make one significant business decision based on analytics. Measure the outcome.
Month 3: Scale and Refine
Weeks 9-10: Add 2-3 additional KPIs. Improve dashboard UX. Document processes.
Weeks 11-12: Calculate ROI. Identify lessons learned. Develop a 6-month expansion roadmap.
Success Milestone: Demonstrate measurable ROI to stakeholders.
Critical Success Factors
Executive Sponsorship: You need a C-level champion holding people accountable.
Start Small, Prove Value: Pilot with one team before company-wide rollout.
Focus on Action: Every dashboard must answer “What do I do differently?”
The 2025 Analytics Trends Reshaping CPG Competition
AI Everywhere (And It’s Not Hype Anymore)
71% of CPG leaders adopted AI in 2024. Those who implemented it properly saw 69% revenue growth.
These results reflect the CPG industry trends 2025 is accelerating: AI becoming table stakes, not competitive advantage.
AI now powers:
- Demand forecasting incorporating weather data (Unilever’s 30% ice cream sales boost)
- Predictive customer lifetime value through CPG marketing analytics
- Automated insights generation surfacing anomalies instantly
Successful AI implementation in CPG follows a 90-day timeline delivering measurable results quickly, starting with intuitive use cases and building integrated systems.
Real-Time Analytics and IoT
Smart shelf sensors detect out-of-stocks, triggering immediate alerts. This real-time capability transforms CPG data analytics from backward-looking reports to forward-looking action.
Connected supply chain IoT tracks shipments in real-time, predicting delays before they impact retail availability.
Integrated Data Ecosystems
Retail media networks share shopper behavior data with brands, creating unprecedented CPG insights opportunities.
Leading CPG-retailer partnerships now involve shared forecasting and joint business planning powered by consumer packaged goods analytics.
Privacy-compliant data clean rooms allow combined dataset analysis without exposing customer information. This represents the future of collaborative CPG marketing analytics.
Sustainability Analytics
ESG tracking now receives the same rigor as financial metrics.
Blockchain enables supply chain traceability for verifiable sustainability data that consumers increasingly demand when making purchase decisions.
Real Success: A regional beverage company with $150M revenue was struggling.
Their $8M annual trade promotion budget couldn’t prove ROI. Inventory management was guesswork. Products were out-of-stock in some stores while overstocked in others.
Week 3 Discovery: Their summer promotion strategy was backwards. Analytics showed July-August promotions delivered 3x better incremental lift than June.
Week 7 Game-Changer: AI forecasting predicted a heat wave two weeks out. They pre-positioned inventory and coordinated with retailers. Result: prevented $800K in lost sales while competitors missed the opportunity.
Six-Month Results:
- 25% forecast accuracy improvement (68% to 85%)
- $1.2M in promotional waste redirected to higher-ROI tactics
- $600K reduction in inventory carrying costs
- 32% decrease in out-of-stocks
- $2.4M incremental revenue
Their analytics investment paid for itself in four months.
For more insight on how AI is transforming beverage supply chains, see Unilever’s ice cream supply chain success story here (Source)
Stop Guessing, Start Growing
The consumer packaged goods industry split into two camps: those turning data into decisions faster than competitors, and those getting left behind.
CPG data analytics transforms every critical decision from promotional strategies to trade spend allocation to supply chain optimization. The difference isn’t just better information, it’s fundamentally different decision-making processes.
You don’t need to transform everything overnight with consumer packaged goods analytics.
Start small. Prove value in 90 days. Scale systematically with CPG insights that actually drive business outcomes.
Key takeaways for successful CPG data analytics implementation:
- Start with strategy, not technology. Define the business problem before buying software.
- Focus on integration. Your data’s value multiplies when sources connect through unified consumer packaged goods analytics platforms.
- Prove ROI in 90 days. Pick one high-impact use case and demonstrate results that stakeholders can’t ignore.
- Build capabilities, not just buy tools. Invest in training and developing organizational muscle around CPG insights.
- Act on insights. The best CPG marketing analytics are worthless if they don’t change behavior and drive decisions.
- Every day you wait is money competitors are capturing through better consumer packaged goods analytics.
- Every day you wait for money competitors are capturing.
The question isn’t whether you need CPG data analytics. It’s whether you’ll implement it before your competition pulls too far ahead.