TL;DR: Measuring Analytics ROI That Actually Works
- Core Framework: Use three pillars to prove analytics value: Direct Revenue Impact, Cost Avoidance, and Risk Mitigation
- The Reality: 95% of analytics projects fail because they can’t connect data outputs to business outcomes
- Proven Results: Organizations using this framework achieve 300-4,600% ROI within 90 days
- Your Action Plan: Start with one high-impact pilot, measure relentlessly using the “So What?” test, and scale what works
- Key Insight: Technical metrics (uptime, dashboards) don’t prove value. Business metrics (revenue, cost savings, risk reduction) do
Quick Answer: What is Data Analytics ROI?
Analytics ROI measures the financial return from data initiatives by comparing business value generated (revenue increases, cost savings, or risk reduction) against total investment costs, including development, maintenance, training, and infrastructure over the project lifecycle.
Why Most Analytics Projects Can’t Prove Their Value
Most data analytics projects fail before they deliver measurable returns. Not because the technology doesn’t work. Not because the data isn’t there. They fail because organizations can’t draw a clear line between their analytics investment and actual business outcomes.
I’ve watched companies spend millions building “modern data stacks” only to end up with dashboards no one uses. The pattern is always the same: impressive technology, vague value propositions, and executives who gradually lose patience.
According to Forrester Research, “Organizations with a data-driven culture are 3x more likely to report significant improvement in decision-making compared to those that don’t.”
The statistics are sobering: while 63% of business leaders describe their organizations as data-driven, nearly two-thirds admit they struggle to translate data into tangible business priorities.
This gap isn’t about technical capability. It’s about measurement discipline.
I learned this lesson early in my career with a manufacturing client. They proudly showed me their analytics platform: 98% uptime, 500+ data sources connected, real-time dashboards on every monitor. Their inventory costs were still ballooning. Production delays hadn’t improved in 18 months.
The problem? Nobody was making different decisions because of the data.
Traditional IT metrics (system availability, data freshness, query performance) measure capability, not value. They answer “Is the system working?” when the real question is “Is the business improving?”
Stop measuring:
- Number of dashboards created
- Data sources connected
- System uptime percentage
- Query response times
Start measuring:
- Decisions made faster
- Revenue generated or protected
- Costs avoided or reduced
- Risks mitigated
The Three Pillars Framework: How to Measure Data Analytics ROI
Every analytics initiative must demonstrate value through at least one of three mechanisms. Miss all three, and you’re running a science fair, not a business program.
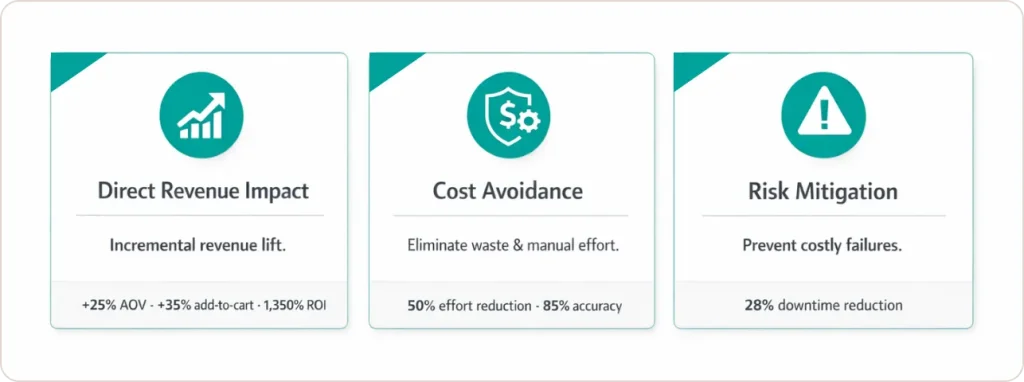
Pillar 1: Direct Revenue Impact
Can you attribute a measurable lift in conversion, sales, or customer lifetime value to this analytics solution?
This is the cleanest form of ROI, but it requires rigorous measurement: a baseline, controlled rollout, and honest accounting of what changed.
Real example: A leading e-commerce platform implemented a hyper-personalized recommendation engine. By comparing cohorts with/without recommendations: 25% higher AOV, 35% more add-to-cart actions, generating millions in incremental revenue on a modest investment—delivering 1,350%+ ROI.” (Source)
The formula:
Revenue ROI = (Incremental Revenue – Total Investment) / Total Investment × 100
($8.7M – $0.6M) / $0.6M × 100 = 1,350% ROI
The keyword is incremental. You’re not measuring total revenue. You’re measuring the revenue lift directly attributable to the analytics intervention.
Pillar 2: Cost Avoidance
How many manual hours did you automate away? What waste did you eliminate? What problems did you prevent?
Cost avoidance is harder to celebrate than revenue growth, but it’s often more substantial. The key is quantifying what would have happened without the intervention.
Real example: Simplifying Finances with AI-Powered Personal Finance Tracker: AI app aggregates bank data (PhonePe, ICICI, SBI) for predictive insights; 50% manual effort reduction, 85% categorization accuracy. (Source)
Pillar 3: Risk Mitigation
What’s the value of not making a million-dollar mistake?
Risk mitigation is the hardest to quantify because you’re measuring things that didn’t happen. But in industries like healthcare, manufacturing, and finance, this is often the most critical pillar.
Real example: A manufacturing client used predictive maintenance analytics to identify equipment likely to fail within 30 days. By addressing issues proactively, they reduced unplanned downtime by 28%.
The value wasn’t just maintenance cost savings ($2.3M). Every hour of unplanned downtime costs them $180,000 in lost production, penalty clauses, and expedited shipping.
Preventing just 15 hours of downtime annually was worth $2.7 million.
By 2023, organizations utilizing active metadata, machine learning and data fabrics will reduce their time to value by 30%.” – Gartner (Rita Sallam, 2020 trends)
The Business Leader’s Guide to Analytics KPIs
Here’s the truth most consultants won’t tell you: business leaders don’t care about your data architecture. They care about data analytics metrics that tie directly to their annual objectives.
When I measure data analytics ROI, I map every initiative to KPIs that already exist in the boardroom:
| Business Function | Traditional KPI | Data-Enhanced KPI |
|---|---|---|
| Sales | Revenue | Customer Lifetime Value (CLV) |
| Marketing | Lead volume | Cost per Acquisition (CAC) reduction |
| Operations | Process time | Throughput optimization |
| Finance | Budget variance | Forecast accuracy improvement |
| Customer Service | Ticket volume | First Contact Resolution Rate |
| Supply Chain | Inventory turns | Stockout prevention rate |
The “So What?” Test
For every metric, apply the “So What?” test three times:
Example:
- Data point: “Our dashboard has 500 active users.”
- So what? “Those users make decisions 3x faster than non-users.”
- So what? “Faster decisions captured 12% more market share in Q3.”
- So what? “That market share is worth $5.2M in annual recurring revenue.”
Only when you can answer “So what?” three times do you have a business metric worth tracking. This is how you prove analytics value in terms that matter to leadership.
Why 95% of Analytics Projects Fail (And How to Be in the 5%)
Let me be brutally honest: 95% of generative AI pilots currently fail to reach full production.
But the issue isn’t the AI. It’s the fundamentals.
Based on dozens of post-mortems I’ve conducted, here’s where initiatives die:
40% fail at data quality Garbage in, garbage out remains true. Solution: Invest in data cleaning before model building. Start with one clean dataset rather than ten messy ones.
30% fail at organizational resistance Culture eats strategy for breakfast. Solution: Start with champions, not mandates. Find the department head who’s eager to try something new and prove value there first.
20% fail at unclear objectives Building a solution searching for a problem. Solution: Define the business outcome first, then design analytics. “We want to reduce churn” is a goal. “We want a customer health score” is a feature request.
10% fail at technical execution The actual modeling or engineering. Solution: Start simple, add complexity only when needed. A linear regression that gets used beats a neural network that doesn’t.
Notice that technical capability is the smallest failure category. Most failures are people and process issues disguised as data problems.
Your 90-Day Roadmap to Prove Analytics Value
Instead of waiting for annual reviews, set 90-day milestones with specific, measurable outcomes:
Days 1-30: Baseline Establishment
- Document current decision processes
- Identify one high-impact use case
- Define success metrics with stakeholder buy-in
- Establish baseline measurements
Success milestone: Executive sponsorship secured, use case defined with clear KPIs
Days 31-60: Rapid Prototyping
- Build minimum viable analytics solution
- Test with small user group (10-20 people)
- Measure decision velocity changes
- Gather feedback and iterate
Success milestone: Working prototype, 60%+ user satisfaction score
Days 61-90: Scale and Refine
- Roll out to broader audience
- Calculate preliminary data analytics ROI
- Document lessons learned
- Identify next use case
Success milestone: Measurable improvement in target metric, business case approved for expansion
This rhythm prevents the “analysis paralysis” that kills most initiatives. You learn by doing, not by planning.
The Measurement Mistakes That Kill Credibility
Even with the right framework, three measurement mistakes will undermine your credibility:
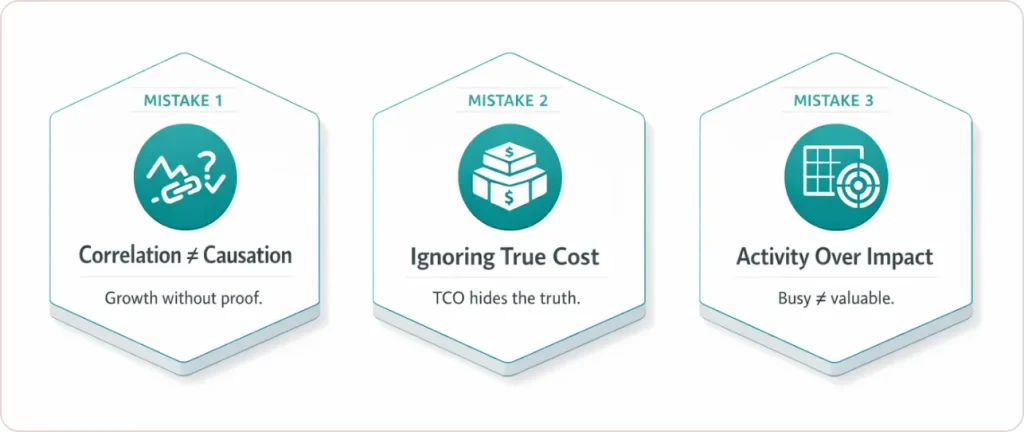
Mistake 1: Claiming Credit for Correlation
Just because revenue increased after you launched a dashboard doesn’t mean the dashboard caused the increase.
The fix: Use controlled experiments whenever possible. Compare outcomes for users who had access to the analytics versus those who didn’t. Measure the same metric before and after implementation.
Mistake 2: Ignoring Total Cost of Ownership
Your analytics ROI calculation needs to include:
- Initial development costs
- Ongoing maintenance and support
- Training and change management
- Infrastructure and licensing fees
- Opportunity cost of team time
Many projects look great when you only count development costs, but fall apart when you include the full five-year TCO.
Mistake 3: Measuring Activity Instead of Outcomes
“We created 47 dashboards this quarter” is not an achievement.
“Our dashboards enabled $2.3M in faster decision-making” is.
Activity metrics make you feel productive. Outcome metrics prove you’re valuable.
Advanced Strategies to Maximize Data Analytics Return on Investment
Once you’ve mastered the basics, consider these advanced approaches to amplify your returns:
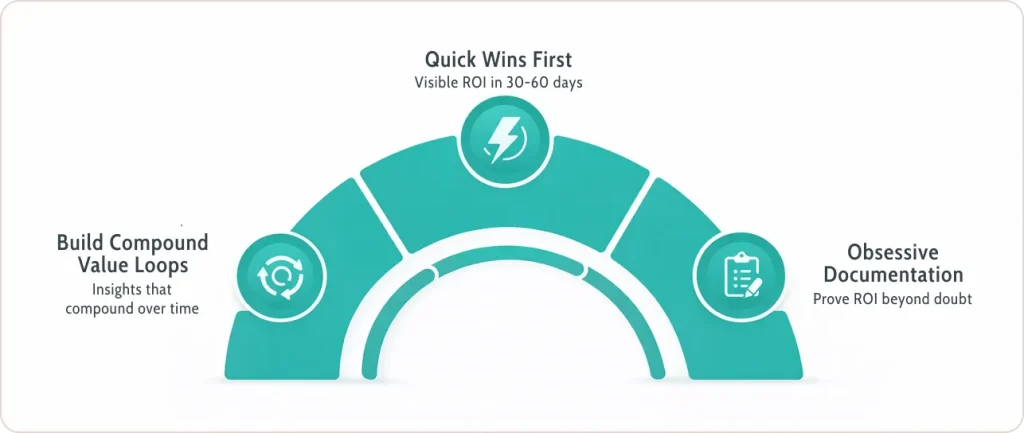
Strategy 1: Build Compound Value Loops
The most successful analytics programs don’t just deliver one-time value. They create feedback loops where each insight enables better decisions, which generate more data, which produce better insights.
For example, a retail client started with a simple inventory optimization model. As it proved value, they expanded to demand forecasting, then dynamic pricing, then supplier negotiations. Each layer built on the previous one, multiplying the overall ROI.
Strategy 2: Prioritize Quick Wins for Momentum
Nothing builds support for analytics like visible success. Identify use cases that can show results within 30-60 days, even if they’re not your highest-value opportunities long-term.
These quick wins serve as proof points that unlock budget and executive support for larger, more strategic initiatives.
Strategy 3: Document Everything Obsessively
The best ROI stories are backed by meticulous documentation. Track every assumption, every data source, every decision point. When you demonstrate 400% ROI, you want ironclad evidence that it’s real.
This documentation also becomes invaluable when scaling successful pilots to other departments or business units.
Building an Analytics Culture That Sustains ROI
Technology delivers initial value, but culture sustains it. Organizations that consistently achieve strong returns from analytics share these cultural traits:
They Make Data Accessible, Not Just Available
There’s a difference between having data and having usable data. The best organizations invest in data literacy programs, self-service tools, and embedded analytics that meet people where they work.
They Celebrate Data-Driven Wins Publicly
When a team uses analytics to drive measurable business impact, successful organizations broadcast it. This creates positive reinforcement and inspires other teams to follow suit.
They Hold Teams Accountable to Metrics
If you define success metrics but never check them, you’re signaling that measurement doesn’t matter. Regular reviews of analytics KPIs keep teams honest and focused on outcomes.
Conclusion: From Dashboards to Decisions
Proving data analytics ROI isn’t a one-time calculation. It’s an ongoing discipline that separates successful data programs from expensive experiments.
The organizations that consistently demonstrate analytics value share three characteristics:
They measure outcomes, not outputs. Success is defined by business metrics (revenue, cost, risk), not technical metrics (queries, dashboards, uptime).
They start small and scale fast. Pilots prove value and build confidence. Grand visions create skepticism.
They treat analytics as a capability, not a tool. Analytics isn’t a software purchase. It’s a new way of operating that requires investment in people, process, and technology.
Here’s what you need to do next:
- Choose one high-impact use case where analytics could demonstrably improve a business metric
- Map it to one of the three pillars (revenue impact, cost avoidance, or risk mitigation)
- Define your baseline and success metrics before you build anything
- Run a 90-day pilot and measure relentlessly
- Show your work with transparent ROI calculations
The gap between organizations that call themselves data-driven and those that actually drive business value with data is execution discipline.