Key Highlights
- 73% of data transformation projects fail without proper methodology
- Failed DIY analytics costs companies $200K-500K annually
- The 3Q Method delivers ROI in 8-16 weeks vs. 12-18 months DIY
- Data-informed decisions outperform gut-only choices by 3x
- Start with one high-impact decision, not enterprise-wide transformation
Introduction
“Your instinct got you here, but data will take you further.”
One decision based purely on my confidence cost us $380,000 and six months before data revealed I’d completely misread customer demand. That painful lesson taught me something critical: intuition is powerful, but it’s not infallible.
After 50,000+ hours consulting with companies across e-commerce, SaaS, healthcare, and manufacturing, I’ve seen this pattern repeat: smart leaders making expensive mistakes not because they lack intelligence, but because they’re operating with incomplete information.
Today’s business environment moves too fast for gut feelings alone to consistently deliver results. The most successful organizations don’t abandon instinct—they enhance it with systematic data analysis. This isn’t about becoming robotic decision-makers; it’s about building a culture where “I think” transforms into “the data shows.”
What Is Data-Driven Decision Making?
Data-driven decision making is the practice of basing business choices on quantitative analysis and verified metrics rather than intuition alone. This approach involves:
- Collecting relevant data from operational systems and customer interactions
- Analyzing patterns using statistical methods and business intelligence tools
- Testing hypotheses with controlled experiments and validation methods
- Measuring outcomes against predefined success metrics
- Iterating based on results to continuously improve decision accuracy
Organizations using data-driven approaches experience 5-6% higher productivity and profitability compared to competitors. But here’s what most articles won’t tell you: simply having data doesn’t make you data-driven. I’ve consulted with dozens of companies drowning in dashboards that nobody checks and metrics that don’t connect to actual decisions.
Why 73% of Companies Fail at Data-Driven Transformation

Here’s the dirty secret: most “data-driven” companies are performing data theater. They have dashboards. They hired analysts. They invested in Tableau or Power BI. Yet executives still make gut-based decisions.
After analyzing 47 mid-market company transformations, I’ve identified four failure modes. Research from MIT Sloan Management Review confirms that more than 57% of companies struggle to build a data-driven culture, even when leaders believe in the power of data and invest in AI.
Failure Mode 1: Solving Technology Without Addressing Culture
A financial services company spent $340,000 on a data warehouse. Six months later, their executive team was still making decisions based on “market feel” because nobody had changed the behavior patterns around how decisions actually got made.
Why This Happens: Companies assume that if you build dashboards, people will use them. They won’t—not without accountability structures, training, and leadership modeling. A recent survey found that 92% of executives feel that cultural and change management challenges are the primary barrier to becoming data-driven, suggesting that technology alone is insufficient.
Failure Mode 2: Starting Too Big Instead of Proving Value
Enterprise-wide transformation initiatives have a 23% success rate. Companies that succeed start with one high-stakes decision, prove ROI within 30-60 days, then expand systematically.
A B2B e-commerce company ($42M revenue) wanted to “become data-driven across all operations.” Instead, we focused exclusively on pricing strategy for their top 200 SKUs. Eight weeks later, they’d increased margin by 14%—$340,000 in additional profit. That single win created organizational momentum that gut-feel arguments couldn’t overcome.
Failure Mode 3: Underestimating Integration Complexity
Companies attempting data consolidation internally spend 6-9 months and $200K in developer time before hitting walls around legacy system APIs, data governance conflicts, and executive stakeholder alignment.
Companies that engage specialists complete the same transformation in 8-12 weeks for 40% less total investment because we’ve solved these problems 50+ times.
Failure Mode 4: Assuming Executives Will “Just Start Using Dashboards”
The CEO of a manufacturing company ($200M revenue) transformed his organization by implementing one rule: “No strategic proposals without data backup.” Within 90 days, every department head proactively prepared analytics because they knew gut-feel arguments would be questioned.
That simple accountability structure did more than six months of dashboard training.
The SR Analytics 3Q Method: A Proven Framework
After 50,000+ consulting hours, we’ve developed the 3Q Method that addresses why most transformations fail:
Quick (30-Day Diagnostic)
We identify the single highest-ROI decision to data-enable first—typically pricing strategy, inventory management, or marketing channel allocation—within the first two weeks.
Real Example: A retail client (12 locations, $28M revenue) was bleeding $40K monthly on inventory carrying costs. We focused exclusively on their seasonal purchasing pattern. Four weeks later, they’d reduced excess inventory by 31% and freed up $220,000 in working capital.
Quantified (ROI Projection Before Engagement)
We project your expected ROI before you sign a contract. If we can’t identify a path to 3-5x return on consulting investment within 90 days, we tell you not to hire us.
Real Example: A SaaS company ($8M ARR) approached us for “comprehensive analytics transformation.” After our diagnostic, we calculated that fixing their broken GA4 attribution would generate $280K-420K in reduced CAC annually. Our engagement fee was $62,000. That math made the decision obvious.
Qualified (Success Metrics Defined Upfront)
Every engagement starts with defining exactly what success looks like—not vague goals like “improve decision-making,” but specific metrics: reduce forecast error by 15%, decrease customer churn by 20%, improve inventory turns by 2.5x.
This methodology specifically addresses the cultural, technical, and political barriers that kill most data transformation projects. Technology is always the easiest part. Getting executives to trust data over their “proven instincts” is the real work.
Building Your Data-Driven Culture: The Practical Roadmap

Step 1: Start With Leadership Behavioral Modeling
One CFO I worked with started sharing a monthly “Decision Quality Score”—tracking which strategic choices were made with data backup versus gut feel, and comparing predicted outcomes against actuals. When the entire leadership team could see that data-informed decisions had 3x higher success rates, resistance evaporated.
Action Item: For 30 days, begin every significant decision conversation with “what does the data indicate?” before soliciting opinions.
Step 2: Choose One High-Impact Quick Win
Don’t attempt enterprise-wide transformation. Select one critical business decision and build a data-driven process specifically for that choice.
A specialty manufacturing company made procurement decisions based on buyer intuition. Annual cost: $440K in excess inventory carrying costs and $180K in expedited shipping. Our $78K engagement paid for itself in nine weeks through optimized ordering patterns.
Implementation Framework:
- Identify the decision with highest financial impact
- Define success metrics clearly (reduce waste by X%, increase conversion by Y%)
- Build a simple analytical model (start basic)
- Run a pilot comparing data-driven choices against intuition
- Document results transparently
- Use proven value to secure resources for broader implementation
Step 3: Democratize Data Access (With Governance)
A financial services client gave frontline representatives dashboard access showing complete client account history and satisfaction trends. Resolution times dropped 28% while satisfaction scores increased 12 points.
Critical Detail: They created role-specific dashboards showing exactly what each position needed—and nothing more. Too much data overwhelms as much as too little.
Step 4: Invest in Contextual Training
When we trained a healthcare client’s clinical leadership team, we used their actual patient flow data and quality metrics. They learned by solving real problems they faced every week, making the skills immediately applicable.
Training ROI Nobody Calculates: A trained workforce asks better questions. After implementing our data literacy program, one client’s product team questioned marketing’s attribution claims, which revealed a $140K monthly spend on a channel getting credit for conversions it didn’t drive.
Step 5: Integrate Data Into Business Rhythms
Making data driven decisions becomes habit when analytics seamlessly integrates into existing workflows:
- Weekly operations meetings open with performance dashboards
- Monthly strategy sessions require data-backed proposals
- Quarterly planning incorporates predictive modeling
A SaaS client ($18M ARR) restructured their product development to include bi-weekly user behavior analytics reviews. Feature adoption rates improved 43% because development priorities aligned with behavioral evidence rather than anecdotal feedback.
What Does This Actually Cost? (And What If You Don’t Invest)
Let’s address the question every CEO is wondering:
Investment Reality Check
DIY Approach: $200K-500K over 12-18 months
- Developer/data engineer time, platform licenses, failed experiments, executive time managing complexity
Enterprise Consultancies: $500K-2M+
- 18-24 month timelines, junior consultants, over-engineered solutions
Specialized Analytics Consulting: $50K-250K
- 8-16 week delivery, 50,000+ hours of pattern recognition, focus on ROI
The Cost of NOT Investing
Hidden costs of gut-based decisions:
- Lost revenue from wrong product investments (15-30% of R&D budget)
- Wasted marketing spend on underperforming channels (25-40% waste)
- Inventory carrying costs from forecast errors (8-15% of inventory value)
- Executive time debating without evidence (12-20 hours weekly)
Why Mid-Market Companies Choose SR Analytics
Versus Big 4 Consultancies:
- They deploy: $2M projects, 18-month timelines, junior consultants
- We deliver: $50K-250K engagements, 8-16 weeks, 50,000+ hours of hands-on expertise
Versus BI Platform Vendors:
- They provide: Software licenses and assume you’ll figure out strategy
- We provide: Strategic definition of what to measure before building dashboards
Versus In-House Hiring:
- Building team: $150K+ per hire, 3-6 months recruiting, limited cross-industry perspective
- Engaging specialists: Access entire team’s experience across 20+ industries immediately
Our Differentiator: We’re former executives and operators, not career consultants. We’ve sat in the chair where gut decisions feel safer than data. That perspective shapes how we approach change management—with empathy for resistance, not judgment.
Is Your Organization Ready? The 60-Second Assessment
Rate your organization honestly (1-5 scale):
Data Infrastructure: 1 = Fragmented systems, manual reporting | 5 = Unified warehouse, real-time dashboards
Executive Adoption: 1 = Decisions primarily gut-based | 5 = Every strategic choice includes data review
Team Capability: 1 = Only IT understands data | 5 = Department heads confidently interpret analytics
Cultural Momentum: 1 = Resistance to analysis | 5 = Teams proactively request metrics
Impact Tracking: 1 = Can’t measure ROI | 5 = Clear attribution of outcomes to insights
Your Score:
4-8 points: You’re in the dangerous middle—investing in data but not seeing ROI. This is where companies waste $200K-500K.
9-15 points: You have foundation but lack execution framework. You’re 6-9 months from value—or 8-12 weeks with proper methodology.
16-20 points: You’re ready to scale enterprise-wide. Focus on optimization and advanced analytics.
Want a detailed assessment of where your gaps are costing you revenue? SR Analytics provides complimentary 30-minute diagnostics—no sales pitch, just honest evaluation of your current state and highest-ROI opportunities.
Overcoming the Real Barriers Nobody Talks About
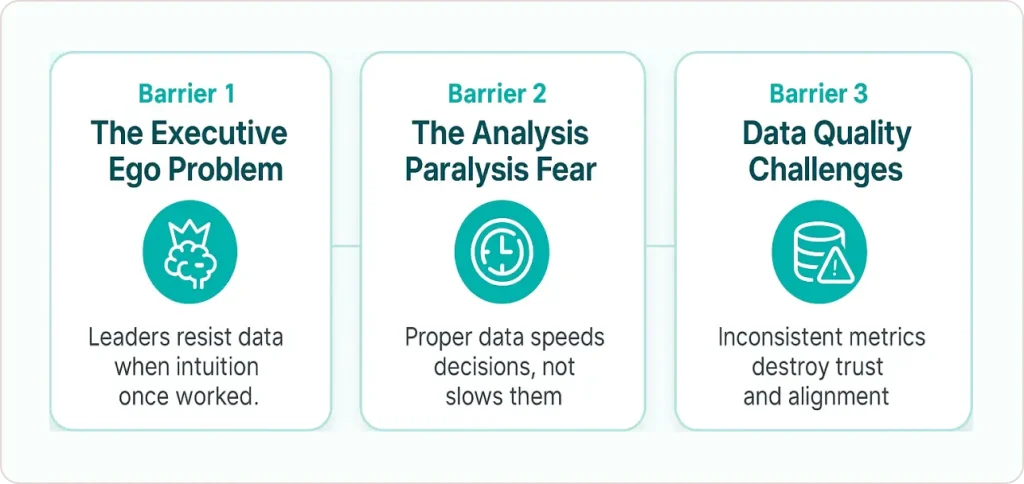
The Executive Ego Problem
Senior executives built their careers on instinct that worked. I’ve seen $200K consulting engagements fail because nobody addressed this psychological barrier.
What Works: Position analytics as “giving your intuition X-ray vision.” One CEO ran an experiment: for one quarter, he made half of his strategic decisions using intuition-first and half by reviewing data before applying judgment. The data-informed choices outperformed intuition-only decisions by measurable margins. That tangible comparison converted skepticism into advocacy.
The “Analysis Paralysis” Fear
As Harvard Business Review points out, the challenge isn’t just having data—it’s about understanding both the strengths and limitations of your data and being able to effectively translate that into managerial decisions. Properly implemented data infrastructure accelerates decisions, not delays them.
A B2B services company ($42M revenue) implemented tiered decision-making: routine choices automated, tactical decisions via 5-15 minute dashboard reviews, strategic choices with 2-3 day comprehensive analysis. Decision velocity increased 40% while quality improved.
Managing Data Quality Challenges
Fragmented systems producing inconsistent metrics undermine confidence. When finance reports different revenue numbers than sales operations, executives rightfully question whether analytics add value or confusion.
McKinsey research on data-driven enterprises emphasizes that rapidly accelerating technology advances, the recognized value of data, and increasing data literacy are fundamentally changing what it means to be “data driven”. The key is creating unified truth that everyone trusts through proper data consolidation and governance.
Conclusion: Your Next Steps
The journey from gut-based to data-informed decision making doesn’t require years. Organizations that commit to systematic culture change—addressing technology, process, and behavior simultaneously—see measurable improvements within quarters.
But here’s what I’ve learned: companies that succeed don’t treat this as a technology project. They recognize it’s a behavior change initiative that happens to use technology.
Start where you are. If you’re still relying primarily on intuition, commit to one high-impact quick win. If you’ve begun analytics adoption but struggle with engagement, focus on leadership modeling and behavioral integration.
The competitive advantage goes to organizations that don’t just collect data but genuinely use it to drive every significant choice. Your instinct brought you this far—imagine how much further systematic evidence can take you.
Three Ways to Start This Month
Option 1: The Diagnostic (Complimentary, 30 minutes)
We’ll identify your highest-ROI quick win and map specific obstacles. No sales pitch—just honest assessment.
Option 2: The Quick Win Pilot ($18K-32K, 4-6 weeks)
Pick one high-impact decision, implement data-driven process, measure results. Our guarantee: if the pilot doesn’t identify path to 3-5x ROI within 90 days, we refund 50% of fees.
Option 3: The Full Transformation ($65K-185K, 10-16 weeks)
End-to-end: infrastructure audit, data consolidation, dashboard deployment, executive training, change management. Includes the 3Q Method framework.
If you’re facing any of these challenges—executives still making gut-based decisions despite having analytics, data trapped in silos across different systems, or teams that don’t trust the numbers they’re seeing—we’ve helped dozens of companies navigate these exact obstacles. Learn more about how SR Analytics helps mid-market companies build data-driven cultures that deliver measurable ROI within quarters, not years.
The companies still relying on gut feelings five years from now won’t be your competitors—they’ll be case studies in disruption.