TL;DR
- Most companies waste 6 figures implementing BI dashboards or AI models when their foundational data infrastructure doesn’t exist
- Data engineering comes first (centralizes scattered data), BI second (visualizes it), AI third (predicts from it)
- 87% of organizations have immature analytics capabilities because they skip the foundation and jump to dashboards or machine learning
- Real cost of getting this wrong: 9–14 month delays, abandoned platforms, and teams that stop trusting data entirely
- The decision is simple: If you can’t answer “What was last month’s revenue?” in under 10 minutes without manual work, you need data engineering first
Quick Answer
Data engineering centralizes scattered data into warehouses. BI implementation visualizes centralized data through dashboards. AI solutions predict outcomes using historical data. Companies must build data infrastructure before implementing business intelligence, and both must exist before deploying machine learning models successfully.
Spent the last decade implementing data systems for mid-market and enterprise clients across healthcare, finance, and retail. The most common question I hear isn’t “how do I build a data warehouse” or “which BI tool should I use.” It’s simpler and more urgent: “What do we actually need?”
Most business leaders know they need better data capabilities. What they don’t know is whether they need data engineering, business intelligence, or AI solutions—or all three. The confusion is understandable. Vendors blur the lines. Software companies rebrand dashboards as “AI-powered analytics.” Consultants pitch six-figure AI roadmaps to companies that don’t have clean data in a single place.
This post cuts through the noise. I’ll explain what each service does, which business problems each one solves, and how to determine what your organization needs right now.
The $380K Failure Nobody Talks About (But You Need to Hear)
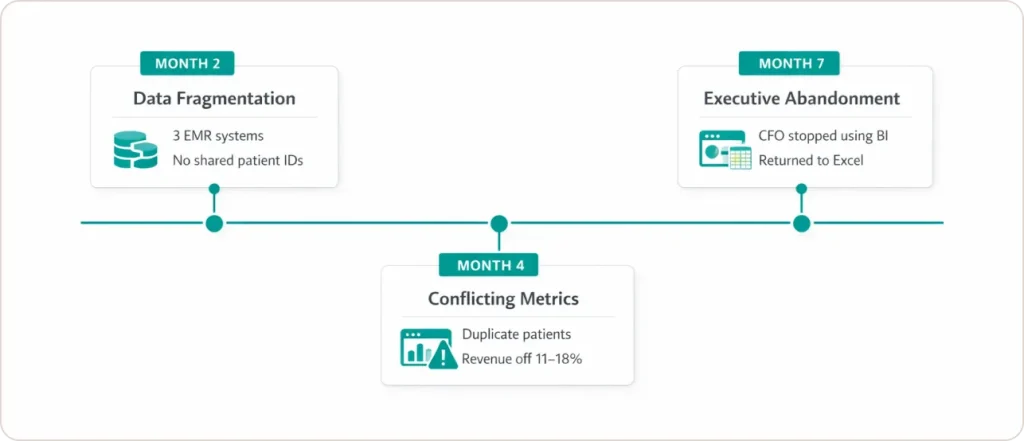
In March 2023, a mid-market healthcare services company hired a respected BI consultancy to build executive dashboards in Tableau. Their CFO wanted real-time visibility into patient volumes, reimbursement rates, and operational margins across 14 clinics.
Budget approved: $85,000 for dashboard development.
Month 2: The BI team discovered patient data lived in three different EMR systems with inconsistent patient ID formats. Reimbursement data sat in a billing system that didn’t talk to the EMRs.
Month 4: The dashboards were technically built, but showed conflicting numbers. The same patient appeared 2–3 times. Revenue reconciliation was off by 11–18%.
Month 7: The CFO stopped using the dashboards entirely. The team went back to manual Excel reports.
Total wasted spend:
- $85K on BI implementation that couldn’t be used
- $120K in internal analyst time attempting to reconcile data manually
- $175K to hire a data engineering firm to rebuild the foundation properly
Timeline to actual working dashboards: 14 months instead of the promised 3.
Root cause: They implemented BI when they needed data engineering first.
Is Data Engineering Just Expensive Plumbing? (No, Here’s Why It’s Your Foundation)
Data engineering is the unglamorous, absolutely critical work of building systems that automatically extract data from scattered sources, transform it into consistent formats, and load it into a central warehouse where analysts and BI tools can actually access it reliably.
You need data engineering when your team spends more than 5 hours per week manually downloading CSVs, copying data between systems, or reconciling conflicting numbers from different departments.
I worked with a medical device distributor in 2024 whose sales data lived in Salesforce, inventory management ran on NetSuite, and shipping information existed only as forwarded emails from FedEx and UPS. When their CFO asked for quarterly margin analysis by SKU, the process involved five people manually exporting spreadsheets and arguing about which numbers were “real.”
Timeline for manual reporting: 3 days
Error rate: ~12%
We built a data pipeline using Fivetran connectors and Snowflake as the warehouse. Salesforce data is synced automatically every night. NetSuite inventory updates flowed in every 6 hours.
Timeline for margin reporting after implementation: 15 minutes
Error rate: ~0.3%
Cost: $67,000
ROI timeline: 4.2 months
Red Flags You Need Data Engineering (Not BI or AI)
Check these against your current situation. If 3+ apply, data engineering is your bottleneck:
- [ ] Monthly reporting requires 3+ people and takes 2+ days to produce
- [ ] Different departments report different numbers for the same metric
- [ ] You can’t answer “How many new customers did we acquire last month?” in under 10 minutes
- [ ] Your “single source of truth” is actually 6 Excel files on OneDrive
- [ ] You’ve attempted to implement BI dashboards before, and they showed conflicting numbers
- [ ] Data quality issues require constant manual corrections
Do You Really Need BI Dashboards if You Have Excel? (Probably Yes—Here’s When)
BI implementation is the process of connecting your centralized, clean data warehouse to visualization platforms like Tableau, Power BI, or Looker to build interactive dashboards that update automatically and let teams explore metrics without waiting on analysts.
You need BI implementation when: Your data is already in a warehouse, reasonably clean, and accessible—but decision-makers still rely on static Excel reports emailed weekly that are outdated within hours.
According to Gartner’s research, 87% of organizations have low BI and analytics maturity, often stuck using spreadsheet-based analysis. BI implementation doesn’t predict the future. It gives you real-time visibility into what’s happening right now.
I implemented Power BI for a logistics company in early 2024. Their data was clean and centralized in Snowflake, but regional operations managers had no way to track delivery delays without emailing the analytics team and waiting 2–3 days for custom reports.
We implemented Power BI dashboards that pulled from Snowflake every 15 minutes:
- Executive view: High-level KPIs, trend lines, geographic heatmaps
- Regional manager view: Drill-downs by route, driver, delay reason
- Operations view: Real-time tracking of active deliveries, exception alerts
Implementation timeline: 9 weeks
Analyst hours saved: ~18 hours per week
Business impact: Operations managers identified routing inefficiencies costing $1.4M annually. Average delivery time dropped 22% within 10 weeks.
Red Flags You Need BI Implementation (Not Data Engineering or AI)
Check these indicators. If 3+ apply, BI is your next move:
- [ ] Your data is centralized and reasonably clean
- [ ] Decision-makers wait days for reports that could be answered instantly
- [ ] You send the same Excel reports weekly, manually updating them each time
- [ ] Executives can’t see current performance without bothering analysts
- [ ] Your analysts spend 30%+ of their time pulling data for reports instead of doing analysis
Should You Actually Invest in AI Solutions? (Most Companies Shouldn’t—Yet)
AI solutions use machine learning algorithms to analyze historical patterns in your data, predict future outcomes, and automate decisions without human intervention.
You need AI solutions when: You have at least 12–24 months of clean historical data, you face repetitive decisions that could be automated, and you want to move from “here’s what happened” reporting to “here’s what will probably happen next” predictions.
The problem: Most companies jump to AI because it sounds impressive, not because their data supports it. According to a recent Gartner survey, data availability and quality are among the top challenges in AI implementation, identified by 34% of leaders from low-maturity organizations.
Here’s what I tell clients: If you can’t trust your current revenue numbers, you absolutely cannot trust a machine learning model trained on that data.
I built a customer churn prediction model in 2023 for a B2B SaaS company with 18 months of clean usage data in BigQuery. We trained a gradient boosting model that scored every customer’s likelihood to churn within 90 days.
Impact: 14% improvement in overall retention, translating to $2.3M in saved annual recurring revenue.
Total project cost: $128,000
Ongoing cost: ~$18K annually for retraining
ROI timeline: 8.7 months
But here’s the critical detail: This company had already completed data engineering and BI implementation. Their data was centralized, clean, and well-understood.
Red Flags You’re Not Ready for AI (Even Though You Think You Are)
Check these honestly:
- [ ] Do you have 12+ months of clean historical data for the outcome you want to predict?
- [ ] Can you currently measure the business metric you want AI to improve?
- [ ] Is your data centralized in a warehouse where models can access it reliably?
- [ ] Can you quantify the ROI if the model performs as expected?
If you answered “no” or “not sure” to 3+ of these, you’re not ready for AI solutions. Focus on data engineering or BI first.
Which Service Should You Actually Implement First? (A Decision Framework That Works)
| What’s True About Your Business Right Now | Start Here | Why This Matters |
|---|---|---|
| Data lives in 5+ disconnected systems, teams manually export spreadsheets weekly | Data Engineering | BI and AI both require centralized, clean data. Foundation first. |
| Data is centralized, but nobody can access it without emailing IT | BI Implementation | You’ve solved infrastructure. Now solve visibility. |
| You have working dashboards and 18+ months of historical data | AI Solutions | You’ve earned the right to invest in prediction. |
| Starting completely from scratch | Data Engineering, then BI, then AI | Skip steps and you waste money. Sequence matters. |
| Competitor just launched an AI feature and your CEO wants one | Pause. Assess your data maturity first. | Copying strategies without foundation wastes $200K+. |
Can You Run Data Engineering, BI, and AI as One Combined Project? (You Can, But You Probably Shouldn’t)
I’ve seen combined projects attempted 7 times. It failed 5 times and delivered partial results 2 times.
Why sequential phasing works better:
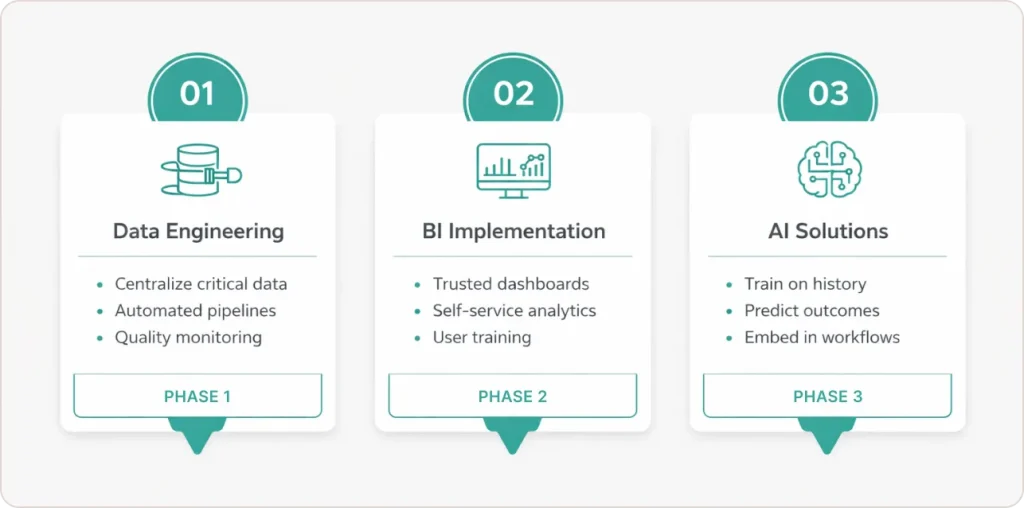
Phase 1: Data Engineering – Centralize your most critical data sources, build automated pipelines, implement quality monitoring
Phase 2: BI Implementation – Build dashboards on centralized data, train users on self-service analytics
Phase 3: AI Solutions – Use historical data to train models, integrate predictions into workflows
Organizations that successfully navigate data and analytics transformation balance opportunities and risks rather than attempting everything simultaneously.
What happens when you try to do all three at once:
A retail company hired three vendors simultaneously in 2025 for data engineering, BI, and AI. By month 4, the AI team couldn’t train models because data quality issues meant historical data was unreliable. By month 11, they essentially restarted with a phased approach.
Total cost: $340,000
Delivered value after 11 months: Minimal
What Are the Expensive Mistakes Everyone Makes? (And How to Avoid Them)
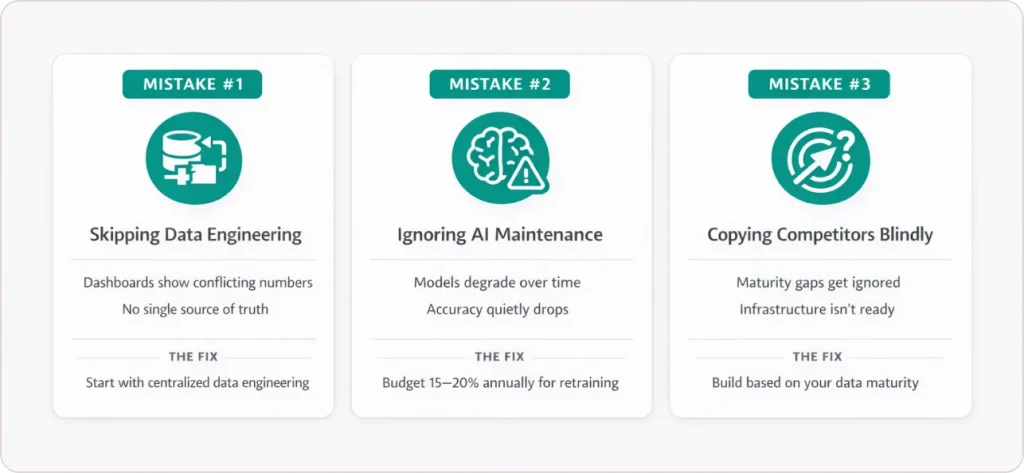
Mistake #1: Skipping Data Engineering Because “BI Looks Cooler”
Executives see impressive demos and immediately want dashboards or AI. They skip the unglamorous work of centralizing data.
What happens: BI dashboards show conflicting numbers. Marketing reports 850 new leads. Sales reports 920. Finance reports 780. Nobody trusts anything.
The fix: If your data lives in disconnected systems, start with a data engineering service. Always.
Mistake #2: Underestimating AI Maintenance Requirements
Companies budget for AI development, but not ongoing monitoring and retraining. Unlike BI dashboards that need minimal updates, AI models degrade over time.
The fix: Budget 15–20% of initial development cost annually for monitoring and retraining.
Mistake #3: Copying Competitor Strategies Without Understanding Your Own Maturity
Your competitor announces an AI-powered feature. Your CEO wants one immediately. You approve budget and start building.
What nobody asks: Does the competitor have 3 years of clean data and infrastructure that took them 18 months to build?
The fix: Choose based on your current data maturity, not industry trends.
The Bottom Line: Stop Guessing and Start With Honest Assessment
Choosing between data engineering, BI implementation, and AI solutions comes down to three questions:
- Where is your data today? (Scattered? Centralized? Clean?)
- What business problem costs you the most right now?
- What capability will create the most measurable value in the next 12 months?
If your data is scattered, data engineering builds the foundation. If your data is centralized but inaccessible, BI implementation delivers immediate wins. If you have mature infrastructure and want predictions, AI solutions unlock competitive advantages.
Build the foundation first. Add visibility second. Layer intelligence third.