TL;DR
- Most data programs stall not because of bad technology, but because no one mapped capability gaps to business priorities before spending started.
- A data strategy assessment gives you a maturity baseline, a scored initiative list, and a decision pack your CFO can act on, not a 60-page report no one reads.
- Skipping Phase 1 is the single biggest failure point. Teams that jump straight into system reviews without anchoring the work to a defined business problem produce roadmaps that never get funded.
- The 5-phase methodology below is built to be run internally or with a partner. Every phase has a defined output, so nothing gets lost.
- If your AI initiatives are stalling, the root cause is almost always a data readiness gap that a structured assessment would have caught in week two.
Quick Answer
A data strategy assessment is a structured diagnostic that evaluates how well an organization’s data capabilities, governance, architecture, and culture align with its business goals, producing a maturity score and a prioritized improvement roadmap.
What Is a Data Strategy Assessment, and Why Do So Many Organizations Get It Wrong?
A data strategy assessment is a time-boxed diagnostic, typically four to twelve weeks, that examines your current data capabilities against where your business needs to go. It answers three questions: where we are today, where we need to be, and what we tackle first.
This is not a data audit. A data audit checks what data you have and whether it is clean. A data strategy assessment asks whether your entire data operating model, governance, architecture, people, tooling, and prioritization logic are organized to deliver business outcomes. Those are different questions requiring different methods.
I have worked through situations where a leadership team was convinced they had a data quality problem. After running a structured assessment, the actual issue was that no one had defined data ownership across business units, so quality degraded because nobody was accountable for it. More tools would have made zero difference. The assessment saved roughly six months of misdirected spending before it started.
According to TDWI’s Data Strategy Assessment research, a data strategy is not about a single platform or analytics system. It spans people, processes, data, and technology working in alignment toward defined business goals. Most organizations assess only the technology layer and wonder why results do not improve.
“Without a data strategy, organizations invest in technology but never change the decisions they make.”Bernard Marr, Data Strategist and Forbes contributor, captures exactly why the assessment step is not optional.
You almost certainly need one if any of these are true right now:
- You have invested in analytics or AI tooling, but results are inconsistent or stuck.
- Different teams report different numbers for the same business metric.
- Data projects get started but rarely reach production.
- Leadership wants AI, but nobody can say whether the data foundation supports it.
- Initiative prioritization feels political rather than evidence-based.
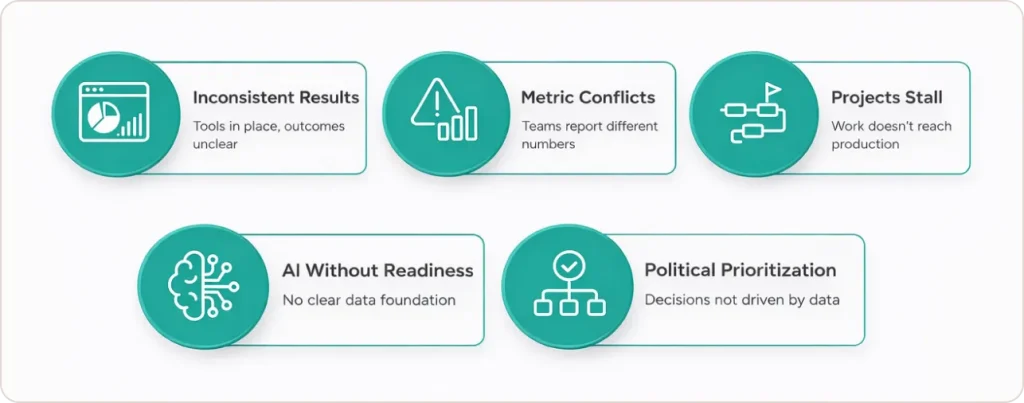
If you are seeing two or more of those patterns, the issue is structural. A data assessment plan is the clearest path to isolating it before you spend another budget cycle in the wrong direction.
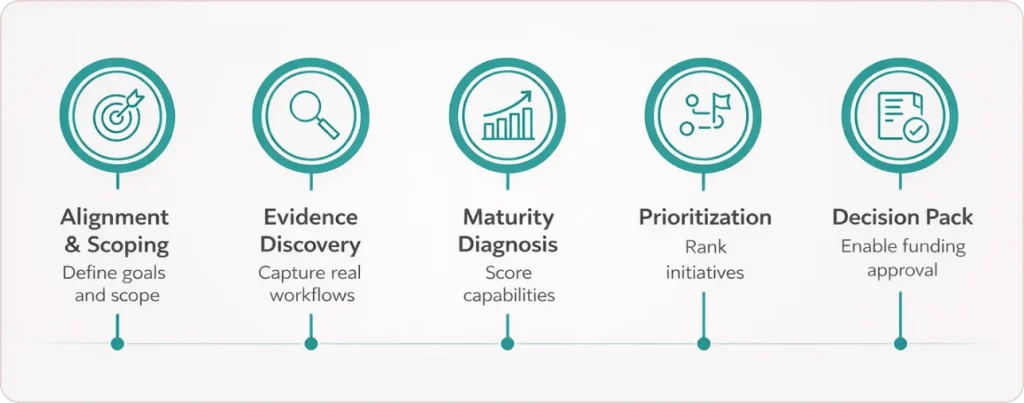
What Are the 5 Phases of a Data Strategy Assessment?
Phase 1: How Do You Align and Scope an Assessment So It Does Not Derail Halfway Through?
Alignment and scoping define the business context before any system or process gets reviewed. You confirm which business goals the assessment must serve, which domains are in scope, who the key stakeholders are, and what a successful output looks like to the people who will fund the roadmap. Output: a scoping brief and a stakeholder map.
This is the most skipped phase and the most consequential one. Teams jump straight to interviewing system owners before anyone has agreed on what the assessment is actually trying to solve. The result is a findings document that answers questions nobody was asking.
SAP’s Data and Analytics Advisory Methodology makes this explicit: scoping and baseline establishment must precede any architecture or capability mapping work. Without a defined business anchor, every finding is equally important, which means nothing gets prioritized, and no executive will sign off on the cost.
Key activities in Phase 1: run a scoping workshop with executive sponsors, document the top three to five business priorities that data must support this year, identify which domains and business units are in scope, agree on the decision the output must support, whether that is a funding request, an operating model change, or a technology roadmap, and set realistic timeline and stakeholder effort expectations upfront.
What good looks like: a one-page scoping brief that a business executive can read in five minutes and approve without a technical glossary.
Phase 2: How Do You Discover Evidence That Reflects Reality, Not What People Want You to Hear?
Evidence discovery means gathering firsthand information through structured stakeholder interviews, documentation reviews, and direct system observations. The goal is to build a factual picture of how data actually flows and gets used, not how the process was designed to work on paper. Output: a completed evidence log organized by domain and capability dimension.
Self-reported maturity is almost always inflated. When you ask a team whether they have a data governance policy, most say yes. When you ask to see it, most cannot produce a version that is current. An evidence log fixes this by requiring a specific artifact to back every maturity claim.
I structure interviews across three layers. Business stakeholders describe where data is helping decisions and where it is creating friction. Operational stakeholders describe how they actually get data when they need it for a time-sensitive call. Technical stakeholders describe what systems exist, where data physically lives, what integrations break regularly, and what the team spends most of its time maintaining versus building.
Key activities: conduct twelve to twenty stakeholder interviews across layers, review existing documentation including architecture diagrams, governance policies, and data dictionaries, catalog active data products and use cases, and log every finding with a domain tag, maturity signal, and supporting artifact. No finding without evidence. No score without proof.
For organizations building out their data infrastructure in parallel with this discovery work, Data engineering services can run alongside the assessment to accelerate the foundational fixes identified in Phase 2 evidence reviews.
Phase 3: How Do You Score Data Maturity Without It Becoming a Subjective Exercise?
Data maturity diagnosis scores your current state across six capability dimensions using a structured rubric on a 1 to 5 scale. The score is driven by evidence from Phase 2, not workshop consensus, which is what makes it defensible when a business leader challenges the findings. Output: a maturity baseline and heatmap.
The U.S. Department of Labor’s Data Management Maturity Model provides one of the clearest public definitions of what each level means in practice. Level 1 is ad hoc with no repeatable process. Level 2 is repeatable but undocumented, meaning it works when the same person is in the seat. Level 3 is defined with standard documented processes. Level 4 is managed with active measurement and monitoring. Level 5 is optimized with continuous improvement embedded in operations.
The U.S. Federal Data Strategy requires agencies to conduct maturity assessments using this scale to track progress year over year. The same structure translates directly into commercial settings.
The six dimensions scored in every engagement are: data governance and ownership, data quality, data architecture and platform, data culture and literacy, analytics and reporting capability, and AI readiness. Here is what that looks like across all five levels: A maturity heatmap then maps these scores across business domains so executives can see where risk is concentrated before a single dollar of the roadmap is approved.
If your Phase 3 heatmap surfaces data governance as a low-scoring dimension, this practical breakdown of how to build a data governance framework from the ground up covers the 7-step structure most organizations are missing.
Phase 4: How Do You Prioritize Initiatives So the Roadmap Survives the Boardroom?
Future state design translates maturity gaps into a scored list of initiatives where every item has a business case attached. This phase prevents roadmap theater, where initiatives get listed in a presentation and then quietly die because no one attached a funding rationale to them. Output: a scored initiative list and a sequenced roadmap by quarter.
The scoring model rates each initiative across five criteria: strategic alignment to the business priorities confirmed in Phase 1, scored 1 to 5; expected business value in terms of revenue, cost reduction, or risk mitigation, scored 1 to 5; implementation feasibility given current team capability, scored 1 to 5; estimated cost and effort on an inverse scale so high cost scores lower; and data readiness, meaning whether the underlying data exists and is accessible today, scored 1 to 5.
The combined weighted score drives sequencing. Not who argued most confidently in the room. Not which initiative the technology team prefers. The score.
The target architecture picture belongs here, too. Based on maturity scores and initiative priorities, you define a target state showing what must change in governance, tooling, and team structure to unlock the roadmap. Keep it conceptual at this stage. A single current-state-versus-target-state diagram is enough to anchor the conversation without triggering a three-month architecture debate before anything gets built.
Phase 5: How Do You Build a Decision Pack That Actually Gets a Data Program Funded?
The decision pack is the most underestimated deliverable in the assessment. It is an executive-ready set of documents, typically five to seven pages plus a presentation deck, that translates the maturity baseline and prioritized roadmap into a funding conversation a CFO and CEO can engage with directly. Output: a decision pack, a presentation deck, and a 90-day mobilization plan.
Most assessments fail here, not because the findings are wrong but because the output is formatted for the person who ran the assessment, not the person who needs to approve the budget.
A funded roadmap requires four things: a narrative that connects specific capability gaps to a measurable business cost or missed revenue opportunity, a sequenced initiative list with effort and value bands rather than point estimates, a governance recommendation that names who will be accountable for results, and a clear answer to what happens if we do nothing, with a directional cost estimate attached.
The 90-day mobilization plan identifies two to three quick wins, low-cost actions that produce visible results fast, alongside the first major initiative to kick off. Quick wins serve one purpose: they demonstrate that the assessment produced real momentum before the next budget cycle creates competing priorities.
One reframe I give every client: the decision pack is not the conclusion of the assessment. It is the opening document of the program. Write it that way, and the transition from assessment to execution becomes almost automatic.
Data Strategy Assessment vs Data Audit: What Is the Difference?
This is the question I get most from leaders who have run audits before and are unsure whether an assessment covers the same ground. It does not. Here is the exact distinction:
| Dimension | Data Strategy Assessment | Data Audit |
|---|---|---|
| Scope | Business goals, capabilities, governance, architecture, and operating model | Data inventory, quality, lineage, and compliance status |
| Primary question | Are we organized to get value from data? | Is our data accurate, complete, and compliant? |
| Output | Prioritized roadmap and executive decision pack | Data quality report and issue remediation list |
| Stakeholders | Business leaders, data leaders, architects, operators | Data engineers, compliance officers, and IT |
| Typical trigger | Stalled programs, AI ambition, leadership change, post-merger integration | Regulatory audit, data migration, and quality incident |
| Duration | Four to twelve weeks | Two to six weeks |
Both are legitimate tools. An audit tells you whether the data is trustworthy. An assessment tells you whether the organization is structured to get business value from it. For organizations with AI or analytics ambitions, the assessment comes first because it determines whether an audit is even the right next action.
What Are the Four Mistakes That Kill a Data Strategy Assessment Before It Produces Results?
According to Gartner analysis, 85% of AI and data projects fail due to poor data quality and scaling issues, often stalling between pilot and production. The assessment phase shows similar patterns across four common failures.
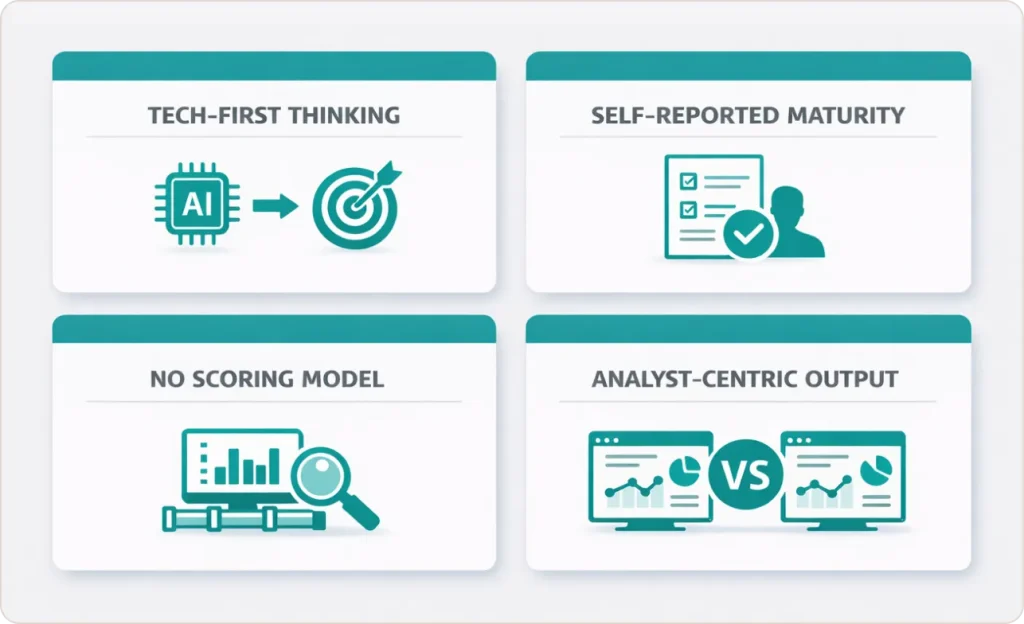
Starting with technology instead of business outcomes. Teams audit their data warehouse before anyone can articulate which business decision the warehouse is supposed to support. Phase 1 prevents this by anchoring every finding to a named business priority before any system is reviewed. If you cannot name the decision, you cannot assess whether the capability supports it.
Treating self-reported maturity as evidence. When you ask a team if they have a data quality framework, most say yes. When you ask to see the monitoring dashboards, the issue log, and the owner who resolves failures, most cannot produce them. Phase 2’s evidence log requirement closes this gap by making every maturity claim artifact-dependent.
Listing initiatives without a scoring model. A roadmap assembled by stakeholder consensus will be reorganized by whoever argues most loudly in the executive review. Phase 4’s scoring model makes the prioritization logic visible and defensible before the politics start.
Formatting the output for analysts instead of decision-makers. A 60-page findings report is not a decision pack. If the output requires a 90-minute briefing to explain, it will not get funded. Phase 5 is designed specifically to produce documents a CFO can read in twenty minutes and act on.
The failure patterns above are not unique to assessments. This detailed look at why analytics projects fail and how to structure one that does not covers the same root causes at the program level.
What Does AI Readiness Look Like Inside a Data Strategy Assessment?
AI readiness is a gate-check built into Phase 3, not an optional add-on. It is the dimension most organizations score lowest, and it is the one that matters most, given where enterprise AI investment is heading.
According to a 2024 Google Cloud report on enterprise AI adoption, the leading barrier to operationalizing AI is not model quality or compute cost. It is data readiness: specifically, the absence of documented data lineage, inconsistent data quality across source systems, and no governance model covering how AI outputs will be reviewed and acted on.
The minimum bar for AI readiness covers four tests. First, can you trace a key data asset from its source system to the model input without relying on a single person’s memory? Second, do defined and monitored data quality thresholds exist for the data assets the AI use case depends on? Third, does the governance model cover who reviews model outputs, who can override them, and what the escalation path looks like when a model produces an unexpected result? Fourth, is there at least one team with demonstrated experience operationalizing a model in a production environment rather than a development notebook?
If the answer to more than two of these is no, AI initiatives need to be sequenced behind foundational work in the roadmap. Not because AI is not the right goal, but because launching AI on a weak data foundation produces exactly the kind of failed pilot that kills organizational appetite for future investment.
If your AI readiness score in Phase 3 surfaces gaps in data infrastructure or governance, this breakdown of why 95% of AI projects fail and what the data foundation fix looks like is the most practical next read.
Conclusion: The Assessment Is the Investment, Not the Prerequisite to One
The most expensive data mistake I see organizations make is treating the assessment as overhead before the real work starts. The assessment is the work. It is where you discover that three of your top five planned initiatives depend on a data governance structure that does not exist yet.
It is where you find out that the AI use case leadership is most excited about requires data lineage that has never been documented. It is where you build the business case that gets a multi-year program funded rather than cancelled after the first quarter.
A data strategy assessment done well, with evidence-based maturity scoring, a defensible initiative scoring model, and a decision pack formatted for executive review, does not just produce a roadmap. It produces alignment. And alignment is what turns roadmaps into programs that actually get built.
If you are a data leader trying to make that case internally, the framework above gives you the structure. If you want a partner to run it alongside you or validate your current approach, SR Analytics works with organizations at exactly this stage of the journey.