As businesses face increasingly complex challenges in 2025, the connection between data visualization & business decision strategies has become more vital than ever. Visualizing data allows decision-makers to move beyond spreadsheets and see the bigger picture—identifying patterns, opportunities, and risks with clarity.
Introduction
Here’s a mind-blowing stat to kick things off: By 2025, the global datasphere is projected to hit 175 zettabytes according to IDC’s Data Age 2025 study, a massive jump from the 33 zettabytes recorded in 2018.
That’s a lot of data. And for businesses drowning in this information tsunami, the challenge isn’t collecting data—it’s making sense of it all.
Enter data visualization for business decisions: the bridge that connects overwhelming information with actionable business intelligence.
By transforming complex datasets into intuitive charts, graphs, and dashboards, organizations can spot trends, identify opportunities, and make decisions with confidence.
Yet despite recognizing the importance of data for decision making, many companies still struggle to leverage their visual analytics effectively.
A McKinsey survey found that while 81% of executives acknowledge data’s importance for decision-making, only 37% feel they’re realizing its full potential.
Let’s dive into the five major reasons why the importance of data visualization in business has reached new heights in 2025, and how your organization can harness visual insights to gain a competitive edge in today’s fast-paced market.
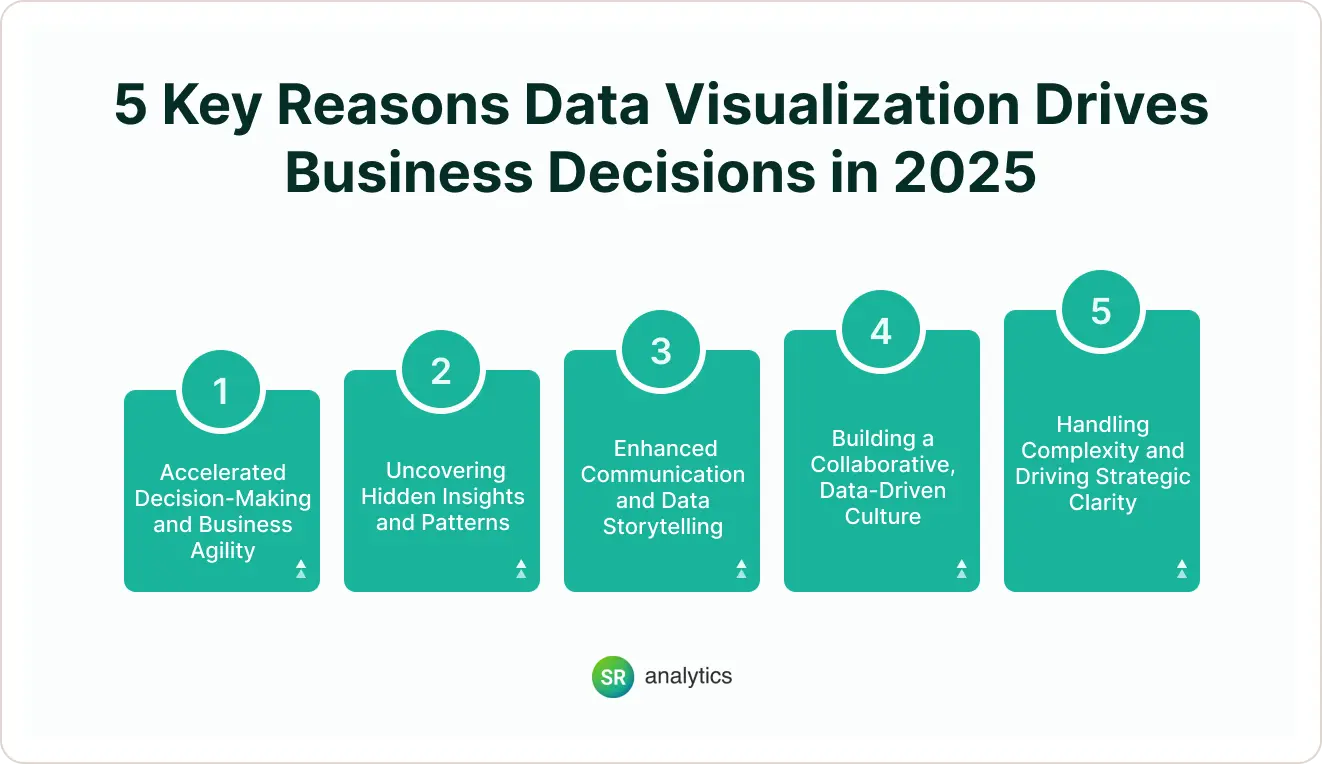
1. Accelerated Decision-Making and Business Agility
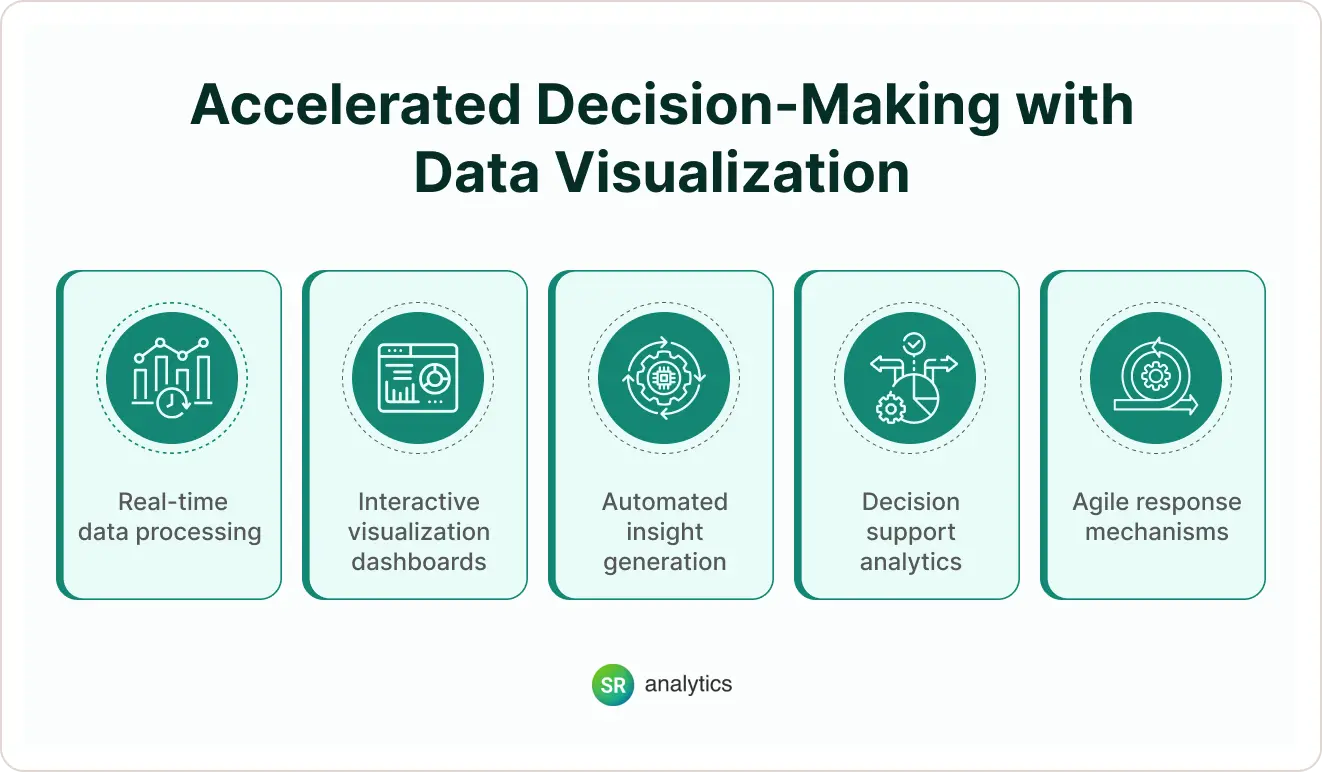
In today’s hypercompetitive business environment, speed is everything.
When opportunities and threats emerge in real time, companies that react quickly gain the advantage. Data visualization & business decision tools are your business’s secret weapon for faster, more confident decisions.
Think about it: Which is easier to process—a spreadsheet with thousands of rows, or a color-coded dashboard that highlights exactly what’s changing?
Real-time visualization dashboards let executives monitor key performance indicators and respond immediately to shifts in the market. For example, rideshare companies use real-time visualization platforms to instantly match drivers with passengers, manage surge pricing, and optimize deployment in high-demand areas.
Seeing live data on maps and charts allows decision-makers to adjust operations on the fly—something practically impossible when wading through raw data reports.
Research backs this up too. Studies suggest data analytics can boost decision-making efficiency dramatically, largely because visualization makes insights immediately obvious. This speed advantage can mean the difference between capitalizing on a trend or watching competitors pass you by.
The visual clarity provided by dashboards also gives leaders the confidence to act decisively. When information is presented visually, it’s easier to grasp and trust—no more endless meetings debating what the numbers actually mean.
2. Uncovering Hidden Insights and Patterns
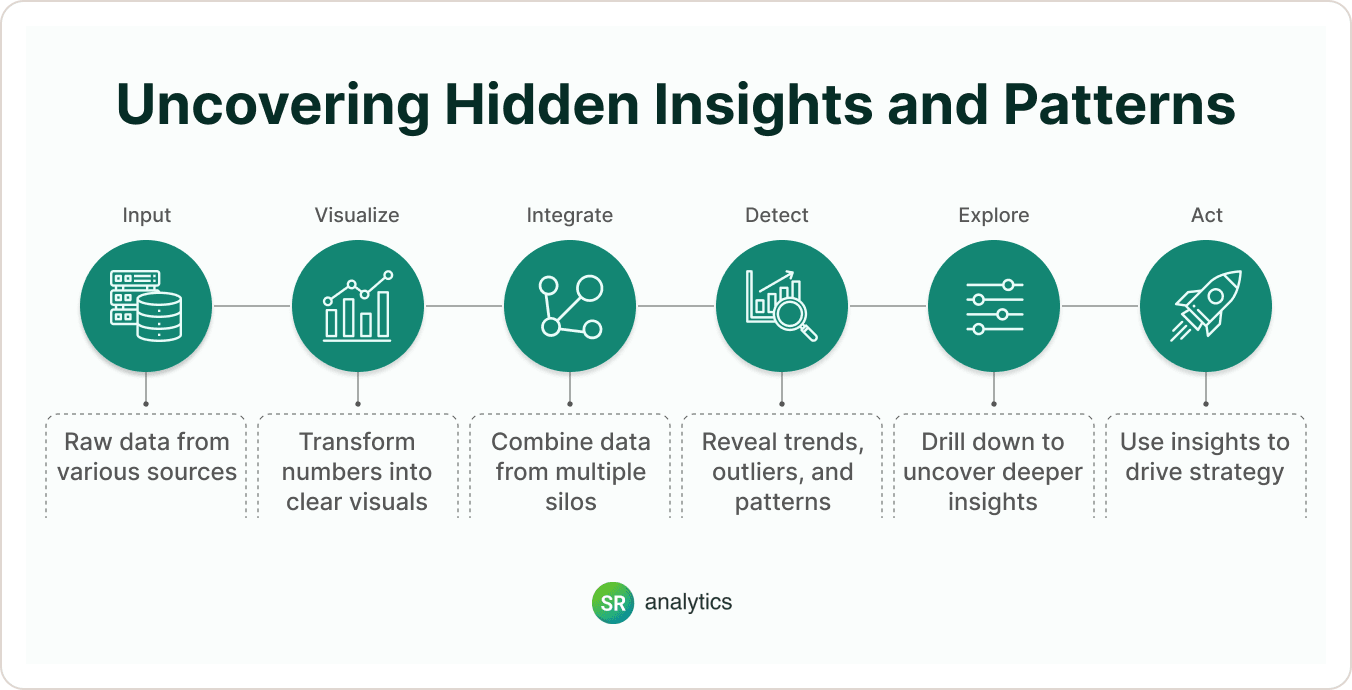
Your brain is incredibly good at one thing: detecting visual patterns. It’s much better at this than scanning rows of numbers (sorry, spreadsheet lovers).
This natural capability makes visualization incredibly powerful for revealing trends, correlations, and anomalies that would otherwise stay buried in your data.
Major retailers leverage visualization to track shopping patterns across their global store networks, adjusting inventory in real time to meet regional demand. By plotting sales data on interactive maps, analysts can instantly spot demand spikes and correlate them with factors like weather events or local festivals.
These visual insights enable precise inventory adjustments that boost both revenue and customer satisfaction. What might take hours of manual data analysis becomes immediately clear through a well-designed chart.
One of the key benefits of data visualization & business decision platforms is the ability to combine information from multiple sources into a unified view. In most businesses, valuable information exists in silos—sales data here, marketing metrics there, customer support feedback somewhere else—making it difficult to see the complete picture. In fact, many examples of this integration through data visualization for business decisions read online show how breaking down these silos enhances clarity and speed.
For example, overlaying marketing spend with sales revenue on a single timeline can instantly reveal whether your campaigns are driving results—a multi-dimensional insight that informs better strategy.
And with interactive visualization tools, teams can perform exploratory data analysis, investigating why trends occur by manipulating charts, zooming into specific timeframes, or filtering by different variables.
3. Enhanced Communication and Data Storytelling
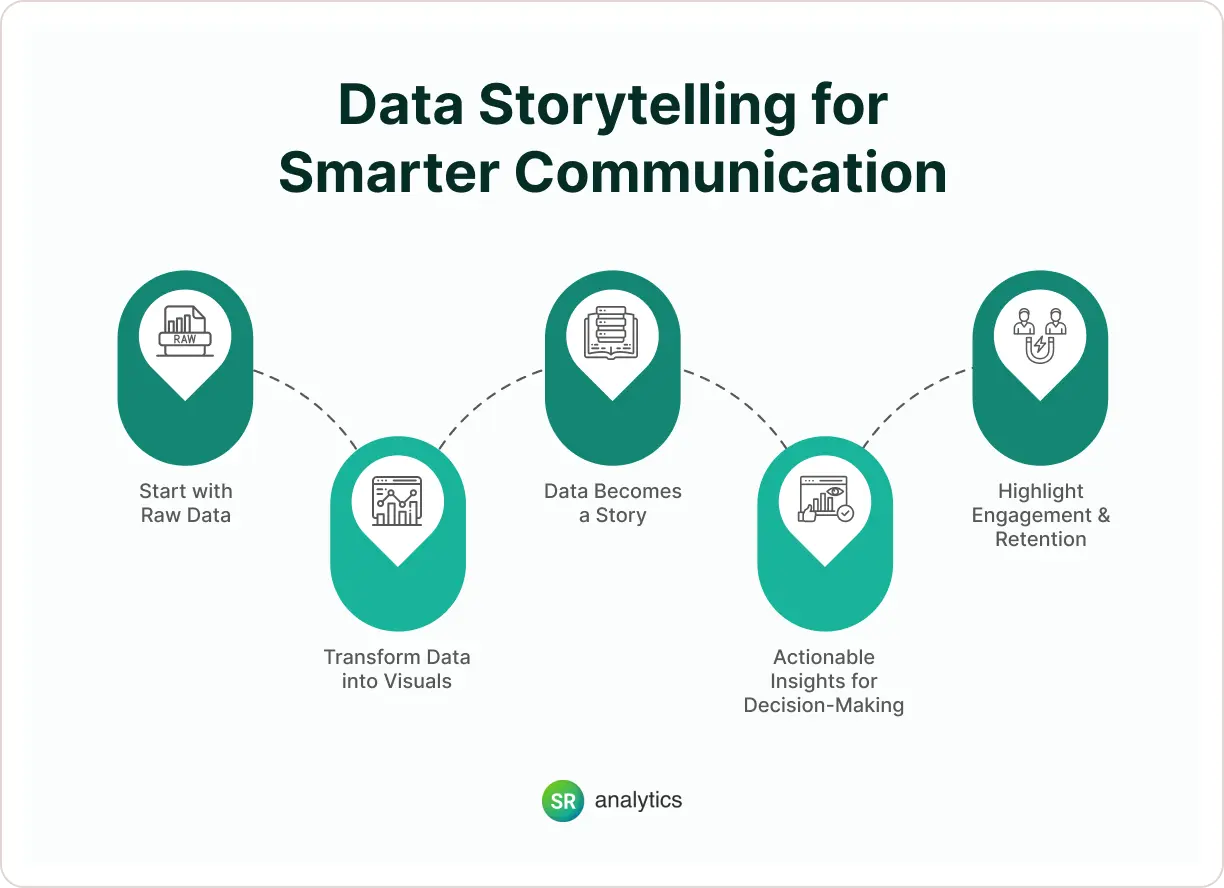
Data visualization & business decision techniques aren’t just analytical—they’re storytelling tools that communicate insights clearly.
Business decisions typically involve multiple stakeholders, many without specialized data expertise. Visualizations translate complex information into a universal language everyone can understand and act upon.
A well-crafted chart or infographic can convey complicated concepts more clearly and memorably than spreadsheets full of numbers could ever hope to achieve.
When data is presented as a narrative, it provides context and meaning that drive decision-making. Leading news organizations use interactive data visualization for business decisions read online to help readers engage deeply with complex issues—a technique equally valuable in boardrooms.
In executive meetings, leaders use visual sequences to tell performance stories: starting with revenue timelines, then breaking down by product line, and finally mapping regional sales. This narrative approach helps audiences understand not just what happened, but why it happened.
The importance of data visualization in business communications cannot be overstated. Instead of overwhelming colleagues with data tables, teams can share dashboards that highlight key points graphically, ensuring everyone interprets information consistently.
Visual content is also inherently more engaging and memorable. Research shows humans process visual information remarkably fast and retain it longer than text. Presenting data with colors, shapes, and motion keeps audience attention, ensuring key insights don’t get overlooked.
4. Building a Collaborative, Data-Driven Culture
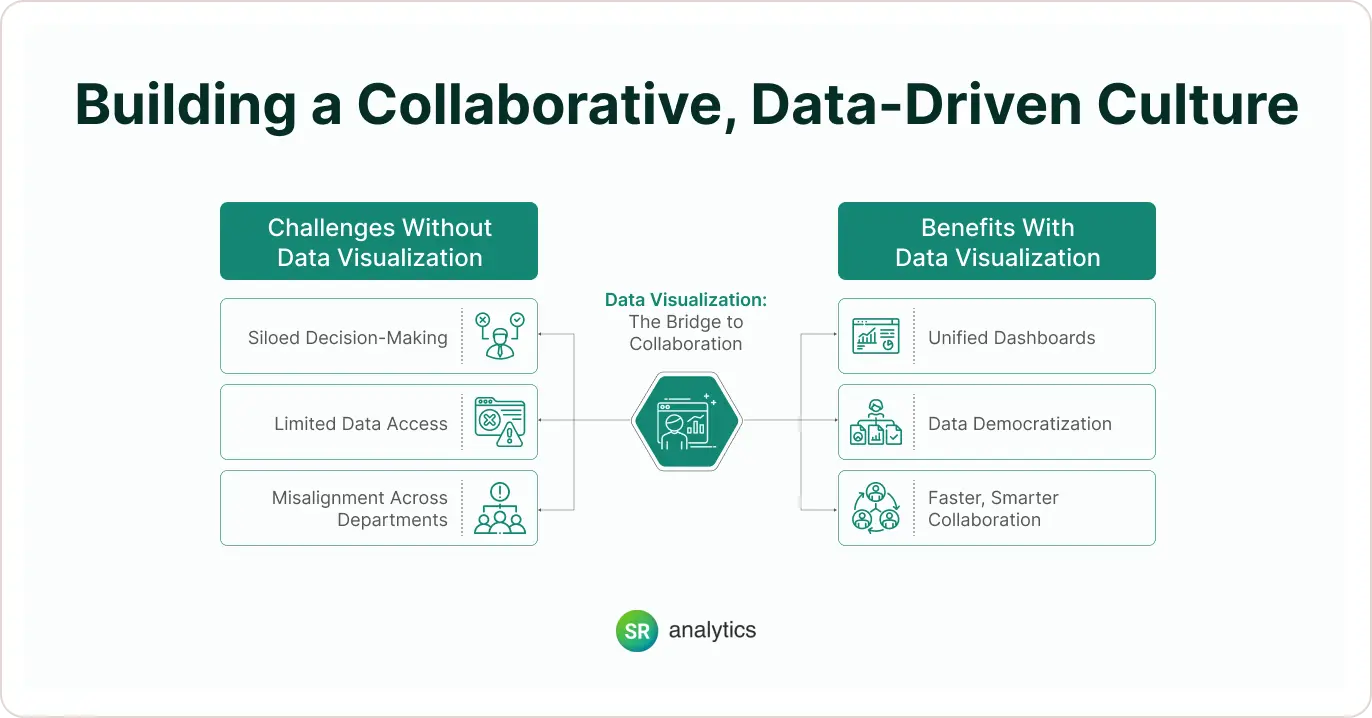
In 2025, winning strategies are data-driven strategies. Full stop.
Organizations need cultures where data visualization & business decision making informs every department—not just the analytics team.
Data visualization for business decisions plays a crucial role in fostering this culture by making data collaborative and democratic. Modern dashboard tools allow teams to share interactive reports easily, so everyone works from the same “single source of truth.”
Major financial institutions use shared data dashboards for trading, risk, and compliance teams to align on real-time market trends. These dashboards ensure all departments have a common understanding, enabling coordinated strategy adjustments.
Without visualization, each team might interpret data differently or work from separate reports, leading to misalignment. Shared visual dashboards act as collaboration platforms where team members can literally point to the same chart when discussing solutions.
Another benefit of data visualization is how it empowers non-experts to participate in data analysis. Not everyone can write SQL queries or perform complex analysis, but with intuitive visuals, a wider range of employees can glean insights.
Healthcare providers use patient data dashboards with heatmaps to spot critical trends without requiring medical staff to have data science expertise, directly improving treatment decisions.
This democratization—making data accessible to everyone—is a major trend. Modern tools require minimal technical knowledge, allowing insights to emerge from anywhere in the organization, not just the data team.
By 2025, most employees are expected to use data to optimize nearly every aspect of their work, according to McKinsey. Achieving this at scale requires tools that simplify data interaction—namely, visualization platforms.
Companies that invest in training staff on these tools and promoting data visibility consistently outperform those relying on intuition alone.
5. Handling Complexity and Driving Strategic Clarity
The fifth crucial advantage that showcases the importance of data for decision making is visualization’s ability to transform complex, overwhelming information into clear, strategic insights.
Today’s business data isn’t just large in volume but also highly complex—streaming from diverse sources like IoT sensors, social media, and operational systems in various formats. Data visualization for business decisions read online simplifies this complexity, distilling multidimensional data into intuitive graphics.
E-commerce giants use dashboards to manage vast logistics and fulfillment operations, handling billions of data points daily. These internal dashboards aggregate metrics like delivery times, inventory levels, and supply chain status, highlighting key indicators that need attention.
By visually flagging anomalies or thresholds requiring action, these tools help managers prioritize issues that could impact business performance, without wading through raw data exports.
Data visualization & business decision alignment also supports strategic planning and forecasting. High-level strategy often relies on projecting trends into the future—something difficult to conceptualize in tables but made clear through charts.
A CEO evaluating market expansion might use a series of visualizations to compare regional performance, project growth, and assess risk factors. Clear upward trend lines combined with strong market share indicators build a visual case for strategic investment decisions.
Many modern BI tools allow users to adjust parameters and instantly see effects on charts. This capability is invaluable for strategic decisions—leaders can visually model outcomes (e.g., how profits would change if material costs rise 10%) and discuss strategy with concrete understanding of trade-offs.
Cutting-edge visualization technologies themselves can be strategic differentiators. AI-driven analytics and immersive visualizations are emerging to handle increasing complexity. AI-powered tools can automatically identify important patterns in big data and present them as charts, while immersive 3D visualizations allow analysts to explore complex relationships in new ways.
How to Enhance Your Decision-Making with Data Visualization
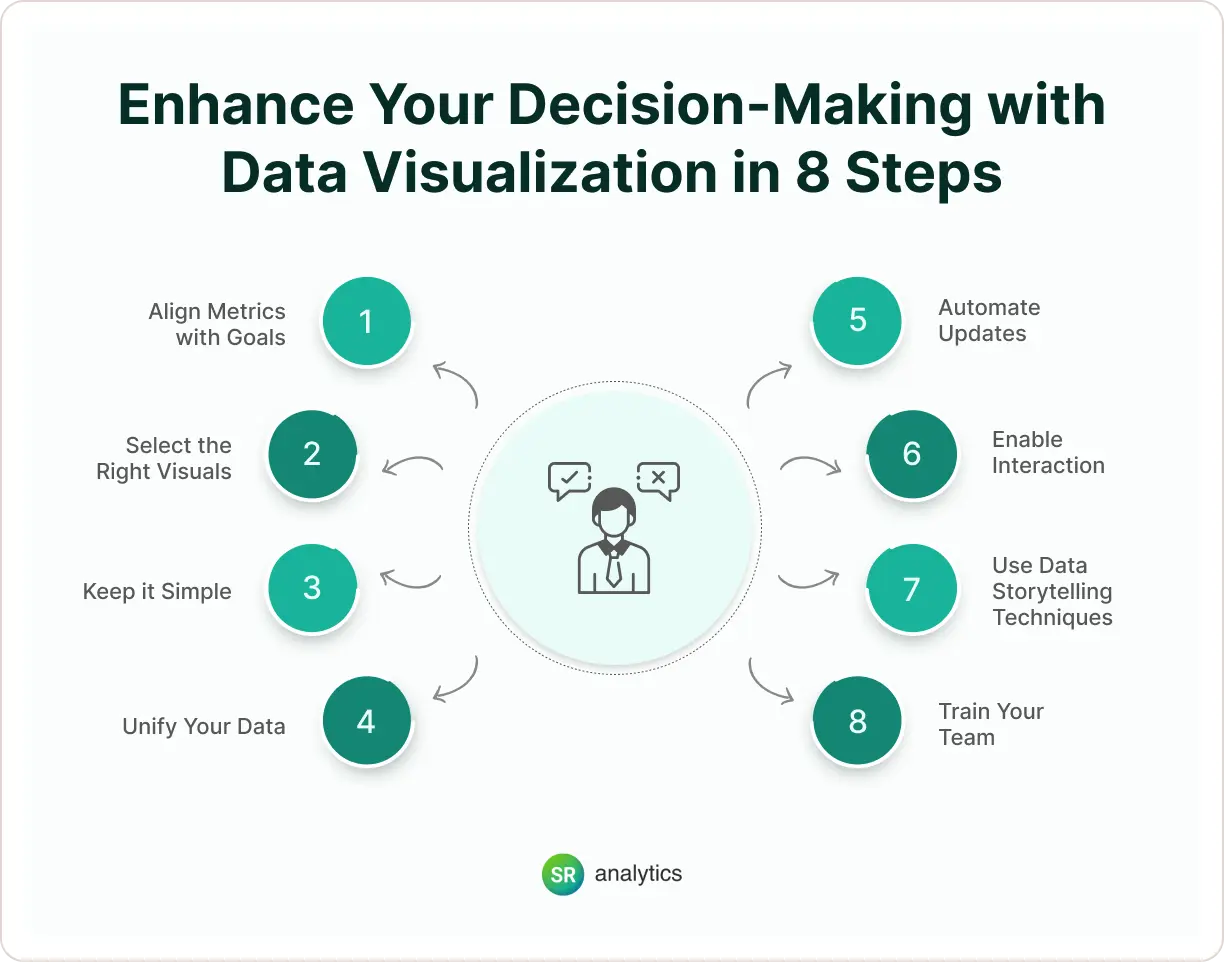
- Define clear metrics aligned with business goals. Focus on visualizing KPIs that directly impact your strategic objectives to avoid information overload.
- Choose appropriate visualization types for your data.Use line charts for trends, bar charts for comparisons, maps for geographic insights, and pie charts for proportion-based visuals. Selecting the right format improves the clarity of your data visualization & business decision strategies.
- Keep visualizations simple and intuitive. Avoid cluttering charts with excessive details and use consistent, clear labeling.
- Integrate data from multiple sources A central visual hub helps decision-makers see the full picture—crucial for understanding the importance of data for decision making in modern business contexts.
- Implement real-time or automated updates to ensure decision-makers always have current information.
- Encourage interactive exploration Allow users to filter, zoom, and drill down into datasets. This interactivity enhances analytical depth and reinforces the importance of data visualization in business intelligence workflows.
- Use data storytelling techniques to frame visualizations in narratives that answer key business questions.
- Train your team Build a data-driven culture by empowering employees to interpret and discuss visuals confidently during meetings. This encourages participation in data visualization for business decisions, even from non-technical roles.
Why Data Visualization is Essential for Business Decision-Making
When you understand the importance of data for decision making, it becomes clear that visuals aren’t just nice to have—they’re mission-critical.
In today’s complex business environment, decisions must be informed by evidence, not intuition alone. Data visualization & business decision-making go hand in hand by transforming raw information into actionable knowledge.
- See patterns and relationships that would remain hidden in spreadsheets
- Respond faster to market changes with real-time dashboards
- Communicate insights more effectively across departments
- Make more confident decisions backed by clear visual evidence
- Simplify complex concepts for all stakeholders
In a business landscape where companies are drowning in data but starving for insights, data visualization for business decisions offers the clarity needed to make sound strategic choices.
Organizations that embrace data visualization for business decisions read online articles, reports, and case studies to stay ahead of the curve, constantly refining their approach to visual analytics.
Conclusion: The Future of Business Decision-Making is Visual
The benefits of data visualization have evolved it from a nice-to-have reporting feature to a mission-critical business capability.
In 2025’s complex, fast-moving business environment, the ability to quickly transform data into clear, actionable insights determines which companies lead and which follow.
By accelerating decision-making, uncovering hidden patterns, enhancing communication, fostering data-driven culture, and bringing clarity to complexity, visualization empowers businesses to make smarter, more timely decisions at every level.
Organizations that recognize the importance of data visualization in business and invest in advanced visualization capabilities will be better positioned to navigate uncertainty, capitalize on opportunities, and drive sustainable growth in an increasingly competitive landscape.
The future belongs to companies that can see clearly through their data—and data visualization is the lens that makes this possible.
Want to read more about data visualization for business decisions? You can explore our related articles online for deeper insights into implementing these strategies in your organization.

