Key Highlights
- Cut 38% wasted spend using statistical channel attribution instead of guessing
- 8-week implementation from data collection to optimized budgets
- Solve multicollinearity that makes 60% of first MMM attempts fail
- Build vs. buy framework matches capabilities to the right approach
- Pilot testing strategy proves ROI before major budget changes
Introduction
“Your marketing dashboard says you generated 312% of actual sales, here’s how to find the truth.”
Your CFO just asked the question that makes every marketer sweat: “We spent $2.4M on marketing last quarter. Which channels actually worked?”
You open Google Ads: “We drove 847 conversions!”
You check Facebook: “We drove 1,203 conversions!”
Your agency reports: “TV generated a 34% lift!”
Add them up, and you’ve apparently generated 312% of your actual sales. Every attribution system claims credit. None tell the truth.
I watched a Series B SaaS company waste $340K over six months because their dashboard showed TV “touched” 12% of conversions. They kept spending. Our Marketing Mix Model revealed the truth in three weeks: TV’s statistical contribution was zero.
This is the multi-channel attribution nightmare costing companies millions annually. Marketing Mix Modeling fixes it by analyzing patterns across your entire customer base using statistical regression, no individual tracking required.
In this guide, I’ll show you exactly how to implement MMM in 8-12 weeks, the critical decisions that make or break results, and how to avoid the pitfalls that kill most MMM projects.
Why Marketing Mix Modeling Solves What Attribution Cannot
Traditional multi-touch attribution is fundamentally broken in 2025. Apple’s ATT blocks 85% of iOS tracking. Google’s cookie phase-out eliminates cross-site identification. Privacy regulations make individual tracking legally risky. Your attribution system now captures maybe 40% of the actual customer journey, then guesses the rest.
Meanwhile, customers see billboards, hear radio ads, visit stores, and ask friends for recommendations. Attribution systems pretend these touchpoints don’t exist because they can’t measure them.
Marketing Mix Modeling takes a completely different approach. Instead of tracking individuals, MMM analyzes aggregate patterns: “When we spent $15K on TV and $8K on paid search in week 23, and sales were $245K, what pattern emerges across 100+ weeks?”
This approach makes MMM naturally privacy-compliant (no individual tracking), immune to cookie deprecation (uses spend totals), and capable of measuring offline channels that attribution misses entirely.
Over 53% of US marketers now use MMM for budget decisions, up from 23% in 2020. Three traditional barriers collapsed:
- Speed: Modern Bayesian techniques deliver insights in 6-8 weeks, not 6-12 months
- Data requirements: Works with 12-18 months of weekly data, not 3+ years
- Cost: Open-source tools are free; SaaS platforms start at $2K monthly versus $150K+ traditional consulting
What MMM Reveals That Attribution Misses
I’ve built 47 MMM implementations across eight industries. Every single one revealed something attribution completely missed:
Offline driving online (and vice versa). A fashion retailer discovered TV campaigns drove 37% of paid social’s attributed conversions. People saw TV ads, searched on Facebook, clicked an ad – converted. Facebook claimed 100% credit. MMM revealed the truth: TV deserved 37%, Facebook 63%. This shifted $120K monthly to integrated campaigns.
Saturation points invisible to attribution. A B2B SaaS company found LinkedIn saturated at $60K monthly while Google Search could scale to $140K, opposite of what attribution suggested.
Channel synergies creating 1+1=3 effects. One retail client’s radio ads didn’t drive direct sales (attribution showed zero) but increased store foot traffic by 40%. Radio’s true ROI was 1.8, not 0.2.
Base sales versus marketing-driven sales. A subscription business learned 62% of sales would happen without any marketing. This reframed their entire ROI calculation and finally made the CFO understand marketing’s true contribution.
Quick Wins Before Full Implementation
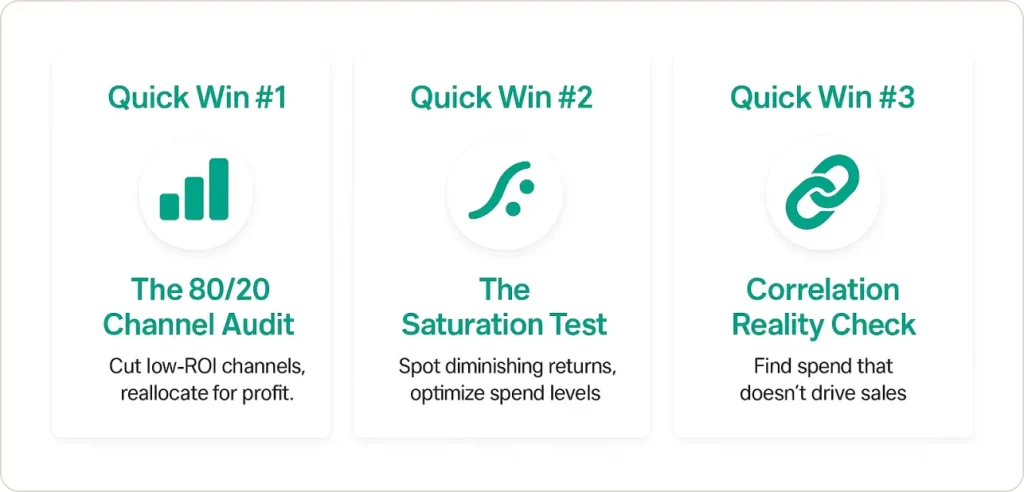
Before diving into comprehensive MMM, three quick analyses will find $50K-$200K in wasted spend this month:
Quick Win #1: The 80/20 Channel Audit (30 minutes)
Export 12 months of spend by channel and weekly revenue. Calculate simple ROI: revenue ÷ spend for each channel. Bottom two channels below 1.5 ROI? Cut 30% immediately and reallocate.
A retail client discovered display advertising ($45K monthly) generated 0.4 ROI while email ($8K monthly) generated 2.1 ROI. Shifted $20K from display to email. Revenue increased 11% with identical total spend.
Quick Win #2: The Saturation Test (45 minutes)
Plot your highest-spend channel: monthly spend (X-axis) versus incremental revenue (Y-axis) over 18-24 months. Flattening trendline? You’ve hit diminishing returns.
One DTC brand spent $180K monthly on Facebook when saturation hit at $120K. The extra $60K generated only $18K in revenue (0.3 ROI). Reallocating that $60K boosted overall marketing ROI measurement by 23%.
Quick Win #3: The Correlation Reality Check (1 hour)
Calculate correlation coefficients between each channel’s weekly spend and weekly revenue over 24+ weeks. Anything below 0.15 shows weak statistical relationship, that channel may not be driving sales despite attribution claims.
A healthcare company found their $90K monthly podcast sponsorship had 0.08 correlation while “underperforming” email showed 0.64. Attribution credited podcasts with 600 conversions monthly, statistically impossible.
The 5-Phase Implementation Framework
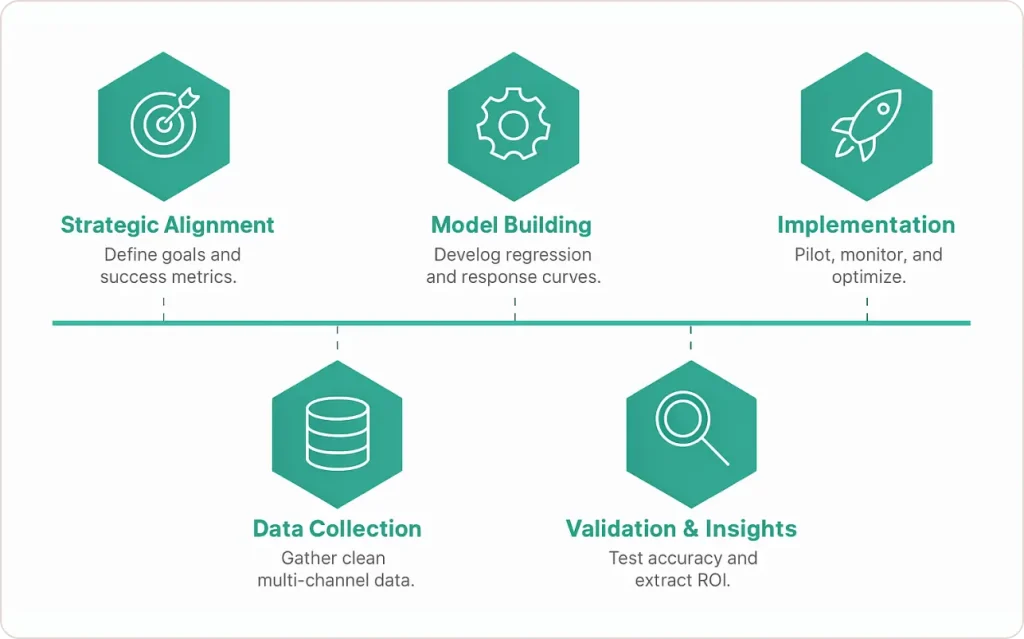
Phase 1: Strategic Alignment (Week 1-2)
Most MMM failures happen before any data gets analyzed. They fail because stakeholders expected different outcomes or nobody planned to use the results.
Start with one brutal question: “What decision will this MMM inform?”
Wrong answers: “Better measurement” (too vague), “Understand our marketing” (not a decision).
Right answers: “Should we reallocate $200K from TV to digital?”, “Can we justify increasing budget from $800K to $1.2M quarterly?”, “Which three channels do we cut if forced to reduce spend 20%?”
Define scope strategically. Your first MMM should cover 4-6 highest-spend channels representing 80%+ of investment. That experimental $800/month TikTok campaign? Group it with “Other.” You need 52+ weeks of consistent spend for statistical significance.
Map your stakeholder ecosystem: Strategic sponsor (CMO) who acts on findings, budget owner (Finance) who controls reallocation, channel operators who implement changes, and analytical executor who builds the model. Get everyone aligned on success metrics now.
Phase 2: Data Collection (Week 2-4)
MMM lives or dies on data quality. Run a comprehensive audit before modeling:
- Marketing spend for each channel at weekly granularity, 18-24 months minimum
- Outcome metrics (revenue, conversions, leads) at same granularity
- External factors (pricing, promotions, seasonality, competitor activity)
For multi-channel campaigns, offline data is critical. TV/radio spend often exists only in insertion orders. In-store promotions require retail ops coordination. PR uses proxy variables like media mentions or brand search volume.
Your data structure: Each row = one week. Columns for date, channel spend (TV_Spend, Search_Spend, Social_Spend), external variables (Base_Price, Promo_Flag, Holiday_Flag), and outcome metric (Revenue, Transactions).
Build a master table in Google Sheets first, before statistical software. Get stakeholders to confirm their channel data looks correct. This catches errors early: “Week 32 shows zero social spend but we ran campaigns…” (Fiscal vs. calendar year mismatch).
The 12-month minimum rule: Modern Bayesian MMM works with 12-18 months if you have strong weekly spend variation. However, if spend barely varies (same budget every week), you need more history. Statistical models need to see what happens when you spend MORE and LESS. No variation = no insights.
Phase 3: Model Building (Week 4-7)
Three critical decisions determine success:
Decision 1: Modeling approach
Multiple linear regression is the foundation: Sales = Base + (β₁ × TV) + (β₂ × Search) + (β₃ × Social) + External Factors.
Each beta coefficient tells you incremental sales per dollar spent. If β₂ = 0.85, every dollar on paid search generates $0.85 revenue. With 40% margin, that’s $0.34 profit per dollar, strong channel.
Bayesian regression lets you incorporate prior knowledge (previous experiments, industry benchmarks). More sophisticated but requires statistical expertise. Start with standard regression, upgrade later if needed.
Decision 2: Critical transformations
Raw regression fails because it assumes linear relationships and immediate effects. You need:
Adstock effects model advertising memory. A TV commercial influences decisions for weeks with diminishing strength. Without adstock, your model undervalues delayed-impact channels (TV, brand campaigns) and overvalues direct-response (paid search).
Saturation curves reflect diminishing returns. First $10K on Facebook might generate $15K sales (1.5 ROI). At $60K weekly, each additional $10K returns only $6K (0.6 ROI). Models apply S-curve transformations to capture this.
Interaction terms catch synergies. If TV advertising boosts branded search, add TV × Search interaction. Be conservative, only test 2-3 suspected interactions to avoid overfitting.
Decision 3: Tool selection
Three paths:
- Open-source (Robyn, Meridian): Free, requires R/Python skills, 40+ hours setup
- SaaS platforms (Recast, Keen, Sellforte): $2K-$20K monthly, point-and-click, fast implementation
- Custom development: Maximum flexibility, requires data science team
80% of companies should start with Robyn (if technical) or mid-tier SaaS (if prioritizing speed).
Phase 4: Validation and Insights (Week 7-9)
Never trust first model output. Run three validation tests:
Hold-out validation: Set aside the most recent 8-12 weeks. Build a model on weeks 1-40, then test prediction accuracy on weeks 41-52. Error exceeding 20%? Your model fits noise, not patterns.
Coefficient logic: All marketing channels should show positive coefficients (more spend = more sales). Negative contribution? Data error, multicollinearity, or wrong variable inclusion.
Multicollinearity diagnostics: When channels always move together (TV and radio both spike Q4), the model can’t separate effects. Check Variance Inflation Factors (VIF), above 10 signals problems. Solution: combine correlated channels into single variable (“Traditional Media” instead of separate TV/radio).
Translate to business insights:
- Channel ROI: Search coefficient 1.20 with 35% margin = $0.42 profit per $1 spent. TV coefficient 0.45 with 35% margin = $0.16 profit per $1. Search is 2.6× more profitable.
- Sales decomposition: Break total sales into base (55%), TV (18%), paid search (12%), paid social (8%), email (4%), other (3%). Answers: “Where did $24M revenue actually come from?”
- Saturation points: Plot response curves. LinkedIn flat above $45K monthly but Google Search linear to $120K? Reallocation opportunity identified.
- What-if scenarios: “Shift $50K from TV to digital?” Model predicts outcomes before you risk real budget.
Phase 5: Implementation (Week 9-12, Ongoing)
Start with pilots, not full-scale changes. Model suggests cutting display 60%? Test in one region first for 8 weeks.
I worked with a retailer whose model showed – radio delivered 0.3 ROI. We piloted: cut radio 100% in three test markets, maintained in three controls. Eight weeks later: test markets saw 2% sales decline (statistically insignificant). Radio truly wasn’t driving incremental sales. The VP Marketing became MMM’s biggest champion because we proved it rather than forced belief.
Build feedback loops:
- Monthly: Compare actuals vs. predictions. Divergence >15%? Investigate immediately.
- Quarterly: Add 12-13 weeks new data, retrain model
- Annually: Comprehensive rebuild, add new channels, update transformations
Communicate in executive language. One-page summary:
Current State: $2.4M quarterly across 6 channels
Key Finding: TV and display (34% of budget) drive only 12% of incremental sales
Recommendation: Reallocate $180K quarterly to search/email
Expected Impact: +$420K revenue (19% increase), +$147K profit
Risk Mitigation: Pilot Southeast region first (8 weeks)
Advanced Considerations
Solving Multicollinearity
Biggest technical hurdle: channels moving together. If Facebook, Google, and email all ramp Q4, your model can’t distinguish individual effects.
Strategic solution: Plan future campaigns with deliberate variation. Week 1-2: Facebook +50%, others normal. Week 3-4: Google +50%, others normal. This generates – statistical signal MMM needs.
Pragmatic solution: Group highly correlated channels. Better to know “Traditional Broadcast” impact accurately than TV and radio impacts incorrectly.
Integrating with Attribution and Experiments
MMM works best as part of comprehensive measurement:
- MMM: Strategic view, annual planning, major channel allocation
- Attribution: Tactical detail, creative performance, keyword optimization
- Experiments: Causal validation, geo tests confirm MMM recommendations
Smart organizations use all three: MMM for quarterly budgets → geo experiment to validate biggest recommendation → attribution for daily optimization. One DTC brand improved marketing efficiency 34% in one year using this integrated approach.
When to Seek Expert Help
You can DIY if: Analyst comfortable with R/Python, solid data infrastructure, 3+ months timeline, internal trust.
Seek data analytics consulting services if: Limited statistical expertise, fragmented data across systems, 6-8 week deadline, or organizational credibility requires external validation.
Both paths work. Tech – startup with brilliant data scientist built MMM in Robyn over six weeks, perfect. Healthcare company with data disaster (12 systems, three ERP migrations) hired us for board-ready results in two months, also perfect.
Decision criteria: Skills, data quality, time, and political capital to own internally? If any answer is “not really,” external expertise accelerates dramatically.
Common Pitfalls and Solutions
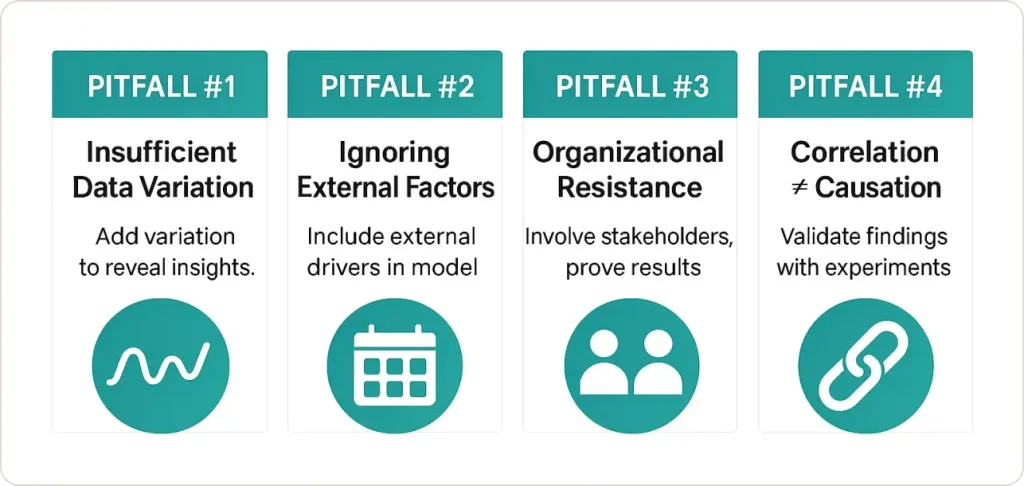
Pitfall #1: Insufficient data variation
Problem: Identical spend every week for 18 months. Model has no signal.
Solution: Ensure history includes periods where spend varied significantly. Plan future campaigns with intentional variation.
Pitfall #2: Ignoring external factors
Problem: Falsely attributing external sales drivers (holidays, pricing, competitors) to marketing.
Solution: Always include variables for seasonality, pricing changes, promotions, product launches.
Pitfall #3: Organizational resistance
Problem: Beautiful model ignored because channel managers felt threatened.
Solution: Involve stakeholders early. Use pilot tests to prove recommendations. Build trust with transparent methodology and scorecard tracking predictions vs. outcomes.
Pitfall #4: Confusing correlation with causation
Problem: MMM identifies correlations, not guaranteed causation.
Solution: Validate major findings with experiments. If MMM suggests email drives huge ROI, test with a holdout group receiving no email for a month.
Conclusion
Marketing Mix Modeling transforms multi-channel campaign management from guessing into scientific optimization. I’ve watched this approach help marketing teams justify budget increases with CFO-friendly ROI numbers, reallocate wasted spend toward high-performing channels, and confidently enter new channels with realistic expectations.
The implementation, from stakeholder alignment through modeling to continuous optimization, spans 8-12 weeks for first insights, then quarterly refreshes. The insights compound: each refresh becomes faster, stakeholder trust builds as predictions prove accurate, and your organization develops true marketing intelligence.
The biggest mistake is waiting for perfect conditions. You don’t need flawless data, unlimited budgets, or PhD statisticians. You need 12+ months of reasonably consistent channel spend data, a clear business question, and commitment to act on findings.
In a privacy-constrained world where traditional attribution is dying, MMM has evolved from nice-to-have analytics into strategic necessity. Organizations mastering it now will make better marketing investment decisions than competitors for years to come.
Ready to optimize your multi-channel marketing mix?
Discover how our data analytics consulting services can help you implement MMM, translate complex models into clear recommendations, and drive measurable improvements in marketing ROI.