")
Key Highlights:
- Predictive maintenance reduces unplanned downtime by 30-50%
- Real-time dashboards cut problem response time from days to minutes
- Data integration delivers 20-25% inventory efficiency improvements
- OEE tracking identifies production bottlenecks 3x faster
- Cloud BI makes enterprise analytics affordable for mid-sized plants
Introduction: The $50,000-Per-Hour Problem Nobody Talks About
“Smart manufacturers are cutting downtime by 40% using data they already own.”
I’ll never forget walking into a mid-sized automotive parts manufacturer three years ago. Their production line had been down for six hours.
The plant manager stood in front of a whiteboard covered in scribbled notes, manually calling each supplier to trace a quality issue that had already cost them $300,000 in lost output.
“We have all this data,” he told me, gesturing to three different computer screens. “But I can’t see what’s actually happening until it’s too late.”
That conversation changed everything for their operation—and it’s the same story I hear from manufacturing leaders across the United States.
Unplanned downtime costs manufacturers billions annually. The real cost isn’t just the emergency repair. It’s the cascading impact: halted production lines, missed delivery commitments, expedited shipping charges, and customer trust erosion.
I’ve spent the last decade implementing Power BI for manufacturing operations. The manufacturers who embrace data-driven decision-making don’t just survive—they dominate their markets while competitors struggle with the same old problems.
This isn’t about fancy technology for technology’s sake. It’s about using information you already collect to prevent problems before they cost money, optimize production schedules that reflect reality, and give your team visibility to make confident decisions in minutes instead of days.
The Manufacturing Data Visibility Crisis
Modern manufacturing generates more data than ever before, yet most plants operate with massive blind spots that undermine efficiency and profitability.
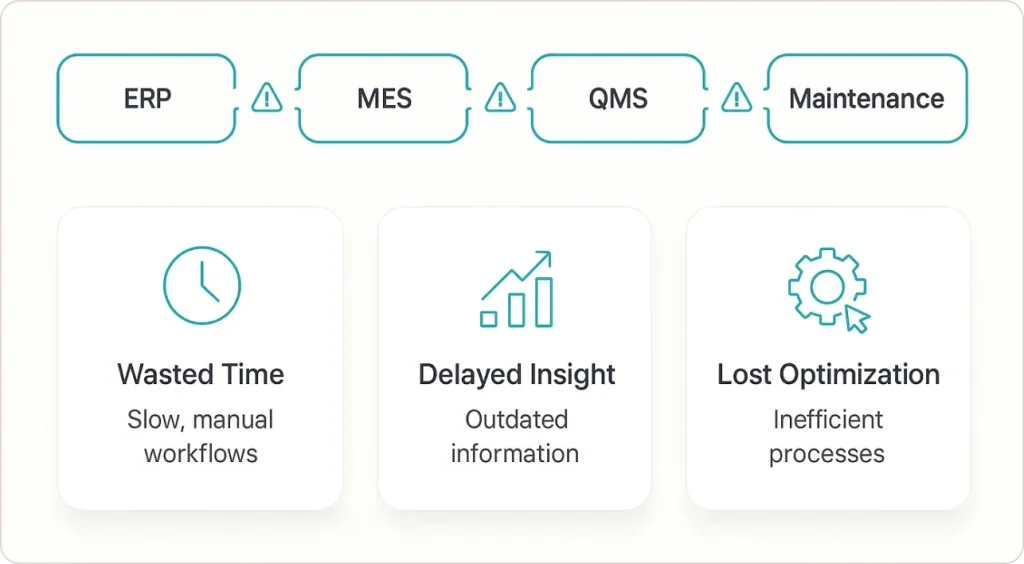
Siloed Systems Creating Artificial Barriers
Your ERP system knows what materials you ordered. Your MES platform tracks production schedules. Your quality management system records inspection results.
But these systems don’t talk to each other.
I’ve walked through plants where procurement orders materials based on last month’s forecast while the production floor screams about different priorities. The maintenance crew relies on fixed schedules instead of actual equipment health data.
This fragmentation costs you three ways:
- Wasted time manually consolidating reports
- Delayed recognition of real-time problems
- Missed opportunities to optimize processes
The Manual Reporting Trap
Without integrated manufacturing dashboards, your team spends hours each week building reports that are obsolete before anyone reads them.
I’ve seen operations managers spending 15-20 hours weekly just preparing reports for Monday morning meetings.
That’s nearly half their time spent reporting what happened instead of preventing what might go wrong.
The Reactive Maintenance Cycle
Traditional maintenance follows two patterns: run equipment until it breaks, or maintain everything on fixed schedules regardless of actual condition.
Both approaches waste money.
The gap between shop floor reality and decision-maker visibility creates a permanent lag in response time. By the time you realize there’s a problem, you’ve already lost the opportunity to prevent it.
How Power BI Transforms Manufacturing Operations
Power BI for manufacturing delivers something traditional systems can’t: unified visibility across your entire operation with predictive intelligence that turns data into preventive action.
This is exactly what manufacturing data analytics solutions enable—connecting disparate systems into a coherent, actionable intelligence layer.
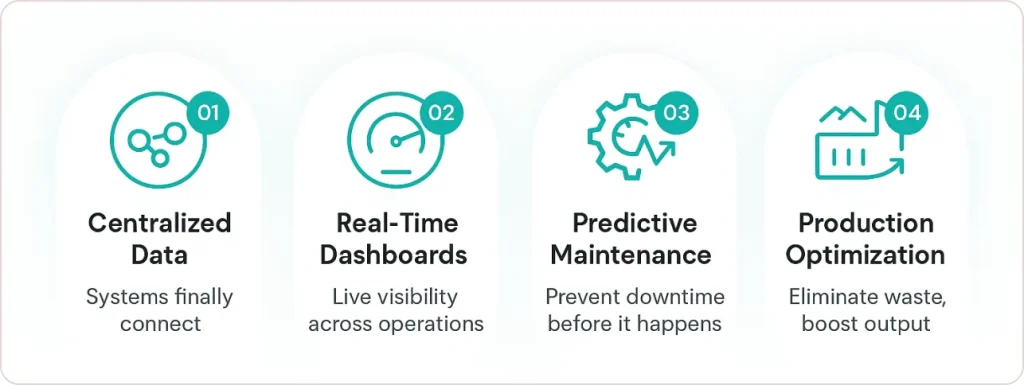
Centralized Data Integration
The foundation of effective manufacturing BI starts with breaking down data silos. A Power BI manufacturing dashboard connects seamlessly with your existing infrastructure:
- ERP platforms like SAP or Dynamics 365
- MES systems tracking production workflows
- IoT sensors monitoring equipment health
- Quality management documenting inspection results
When a machine’s vibration sensors detect unusual patterns, that information flows directly into the same Power BI dashboard for manufacturing showing production schedules, maintenance history, and quality metrics.
I implemented this for a food packaging manufacturer running three separate reporting systems. After integrating their systems through Power BI for manufacturing, they gained real-time visibility across procurement, production, and shipping—cutting lead time variability by 35% within the first quarter.
Real-Time Dashboards
Static reports tell you what happened last week. Real-time manufacturing dashboards show you what’s happening right now and what’s likely to happen next.
A proper Power BI dashboard for manufacturing displays:
- OEE tracking how efficiently machines run
- Production output versus planned targets
- Equipment health scores predicting maintenance needs
- Quality control metrics flagging defects at source
- Inventory levels optimized against demand signals
When a production line’s OEE drops below threshold, the KPI dashboard manufacturing alerts the right person, displays which specific machine is causing the problem, and provides historical context.
Predictive Maintenance
This is where manufacturing BI delivers its most dramatic ROI.
Studies show that predictive maintenance can reduce machine downtime by 30% to 50% and increase machine life by 20% to 40%. Power BI for manufacturing enables these outcomes through advanced analytics.
Power BI for manufacturing analyzes patterns from IoT sensors:
- Vibration data
- Temperature fluctuations
- Power consumption
- Acoustic signatures
- Operational stress indicators
Machine learning algorithms identify subtle patterns that precede failures, often catching problems 6-8 weeks before traditional monitoring would detect them.
I worked with a metals processing facility averaging 12 unplanned downtime events per month, costing them roughly $45,000 per incident.
After implementing predictive maintenance through their Power BI manufacturing dashboard, they reduced unplanned stoppages by 42% in the first year.
The system transformed their maintenance culture from firefighting to optimization.
Production Optimization
Beyond preventing failures, manufacturing business intelligence reveals optimization opportunities hidden in your operational data.
Power BI for manufacturing:
- Analyzes production schedules against actual throughput
- Identifies bottlenecks that constrain output
- Compares changeover times across product transitions
- Tracks material waste patterns
- Pinpoints quality issues at their source
One electronics manufacturer I worked with discovered through their Power BI dashboard for manufacturing that 70% of their quality defects occurred during the first 30 minutes after changeovers.
This insight led them to implement a warm-up protocol that reduced defect rates by 28% without any capital investment.
The Real ROI: Beyond the Buzzwords
Every consultant promises ROI. Let me show you exactly how Power BI for manufacturing delivers measurable financial impact.
Quantifying Downtime Reduction Value
In the automotive industry specifically, unplanned downtime costs reach $2.3 million per hour, or $600 per second according to ISM World research. For mid-sized manufacturers, a reasonable estimate is $50,000 per hour of lost production.
If your plant experiences 8 hours of unplanned downtime monthly, that’s $400,000 in annual losses.
Predictive maintenance through manufacturing BI typically reduces unplanned downtime by 30-40%. Using the conservative 30% figure, you’re saving $120,000 annually just from better maintenance timing.
The manufacturer I mentioned earlier was losing $540,000 annually to unplanned stoppages. Their Power BI expert for manufacturing implementation cost roughly $75,000 (software licenses, consulting, integration).
They hit breakeven in 4.5 months and saved over $225,000 in year one alone.
Decision Speed as Competitive Advantage
Traditional reporting creates a decision lag that compounds daily.
I tracked this with a precision machining company. Before implementing real-time manufacturing dashboards, their typical response time from problem identification to corrective action averaged 11 days.
After deploying Power BI for manufacturing, that dropped to 2.1 days—an 81% improvement.
Faster decisions mean smaller problems. A quality drift caught on day two requires minor process adjustment. The same drift caught on day eleven requires scrapping an entire production run.
Productivity Gains Through Visibility
When plant managers can see real-time OEE trends on their KPI dashboard manufacturing, they make better tactical decisions about resource allocation.
One automotive supplier I worked with increased their overall OEE from 67% to 78% within eight months of implementing manufacturing BI dashboards.
That 11-point improvement translated to producing 16% more output from the same equipment and labor.
Implementation Framework: Getting It Right
I’ve seen Power BI for manufacturing implementations that transformed operations in 12 weeks—and others that failed after 18 months.
The difference isn’t the technology. It’s the approach.
Phase 1: Define Success Metrics (Weeks 1-2)
Don’t start by building manufacturing dashboards. Start by identifying exactly what decisions need to improve.
Key actions:
- Gather cross-functional team (production, maintenance, quality, supply chain, finance)
- Ask: “What’s the most expensive problem you can’t see coming?”
- Identify decisions hampered by lack of timely data
- Define KPI dashboard manufacturing priorities
These specific pain points become your foundation. You’re not building generic dashboards—you’re solving real business problems with measurable impact.
Phase 2: Data Integration (Weeks 3-6)
This phase determines whether your Power BI for manufacturing implementation delivers value or becomes an expensive science project.
Critical steps:
- Connect ERP for materials and costs
- Integrate MES for production tracking
- Link SCADA/IoT for equipment data
- Add quality management for defect tracking
- Establish data governance standards
You’ll discover data inconsistencies. This isn’t a failure—it’s a necessary discovery process. Power BI experts for manufacturing know to allocate time for data cleansing before building analytics.
Phase 3: Dashboard Development (Weeks 7-10)
Start with one high-impact Power BI dashboard for manufacturing that solves a specific problem.
Best practices:
- Begin with OEE tracking or predictive maintenance
- Build working prototype in week 8
- Get it in front of actual users—not executives
- Iterate based on feedback from people who live in the data daily
A maintenance supervisor will tell you immediately if the equipment health scoring makes sense. The best manufacturing dashboards are co-created with users.
Phase 4: Scale and Sustain
Once your pilot delivers measurable results, expand systematically.
Scaling strategy:
- Add more use cases incrementally
- Deploy to additional production lines
- Broaden user groups progressively
- Establish rhythms where insights drive action
The biggest implementation failures weren’t technology problems. They were organizations that built sophisticated Power BI for manufacturing dashboards and then continued making decisions the same way they always had.
Avoiding Common Implementation Pitfalls
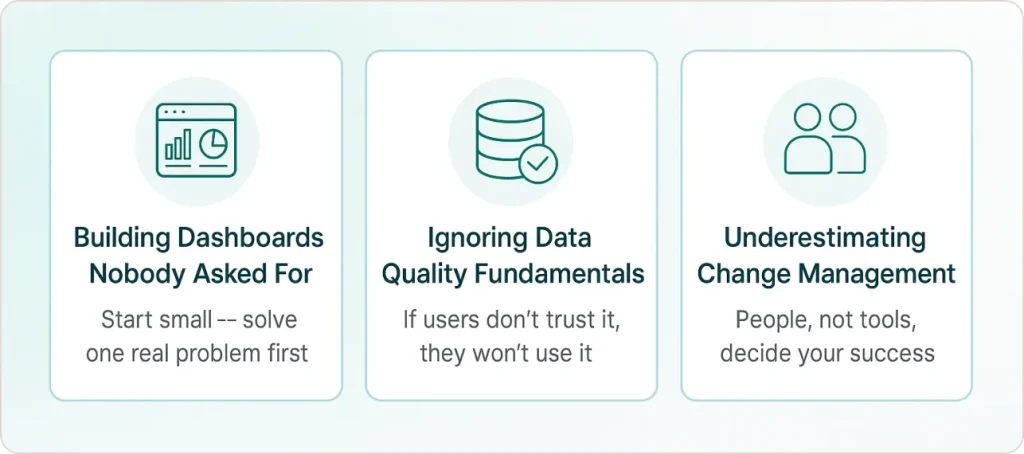
Building Dashboards Nobody Asked For
The most expensive mistake: hiring consultants who build comprehensive Power BI manufacturing dashboard suites without understanding your actual business problems.
I reviewed a failed implementation where a manufacturer spent $280,000 building 47 different manufacturing dashboards. Most users looked at them once and never returned.
Start narrow. Solve one problem completely with your Power BI for manufacturing before expanding.
Ignoring Data Quality Fundamentals
You can’t analyze data you don’t trust.
I recommend a simple litmus test: show your data to the frontline supervisors who live it daily. If they immediately spot errors or question the numbers, you have data quality work to do before building analytics.
Underestimating Change Management
Technology is the easy part. Getting people to change how they work is hard.
This cultural shift requires:
- Training and clear communication
- Quick wins that prove value
- Celebration when insights prevent problems
- Connection to outcomes people care about
Show patience. Make the data accessible. Connect analytics to results that matter.
Advanced Analytics: The Next Frontier
According to Deloitte’s 2025 Manufacturing Industry Outlook, 78% of manufacturers have implemented or are planning to invest in supply chain planning software, recognizing advanced analytics as critical to competitive advantage.
Once you have foundational manufacturing BI in place, several advanced capabilities deliver even greater value.
Machine Learning for Quality Prediction
Beyond predicting equipment failures, machine learning models in your Power BI for manufacturing can forecast quality issues before they occur.
One precision manufacturer I worked with developed a Power BI manufacturing dashboard model that predicted quality defects with 87% accuracy up to 4 hours before they occurred.
This advanced warning allowed real-time process adjustments that reduced scrap rates by 31%.
AI-Powered Anomaly Detection
Standard KPI dashboard manufacturing solutions flag threshold breaches. AI-enhanced systems detect subtle anomalies that humans would miss.
An AI algorithm in your Power BI dashboard for manufacturing might notice that a specific combination of temperature, pressure, and feed rate—each within normal ranges individually—consistently precedes quality issues when they occur together.
Supply Chain Risk Prediction
Advanced Power BI manufacturing dashboards can incorporate external data—supplier financial health, regional weather patterns, geopolitical risk indicators, and transportation disruptions.
I worked with an electronics manufacturer who integrated shipping data, port congestion indicators, and supplier performance metrics into their manufacturing BI environment.
This gave them 3-4 weeks advance warning of material shortages, allowing proactive mitigation rather than reactive scrambling.
Choosing the Right Power BI Expert for Manufacturing
Not all Power BI consulting is created equal. Manufacturing requires specialized expertise that generic BI consultants often lack.
Domain Expertise Matters
Look for Power BI experts for manufacturing who understand manufacturing operations, not just data visualization.
They should:
- Speak your language (OEE, preventive vs predictive maintenance, MES vs ERP)
- Ask about specific challenges before proposing solutions
- Share concrete examples from similar implementations
Focus on Business Outcomes
The best Power BI experts for manufacturing measure success by business impact, not technical specifications.
They should discuss:
- Downtime reduction percentages
- OEE improvements
- Inventory optimization
- Decision speed enhancements
Not just how many data sources they connected or manufacturing dashboards they built.
Ongoing Support
Your manufacturing BI needs will evolve. Processes change. New equipment gets added. Business priorities shift.
Choose a Power BI for manufacturing partner who provides ongoing support and optimization, not just initial implementation.
Taking Action
You now understand how Power BI for manufacturing transforms operations from reactive to predictive, from siloed to integrated.
Start with one high-impact use case. Predictive maintenance delivers the fastest ROI for most manufacturers. Choose the problem that’s costing you the most money right now.
Assemble a cross-functional team that includes operations, maintenance, quality, and IT. Define success metrics that matter to your business.
The manufacturers winning in today’s competitive environment see problems developing before they become crises, optimize processes using insights hidden in their data, and make confident decisions based on real-time intelligence.