TL;DR
- Predictive data analytics services forecast what will happen next, not just what happened. Most companies already have enough data to start. Most are not starting correctly.
- The #1 reason implementations fail is not the model. It is the absence of a financial guardrail before the model is built.
- Prediction without a connected action is just expensive foresight. Every model needs a closed feedback loop to compound accuracy over time.
- This post gives you a practical decision framework. If you finish reading and still cannot identify one high-value use case for your business, the problem is not your data.
Quick Answer
Predictive data analytics services use machine learning and statistical modeling applied to historical business data to forecast future outcomes, surface operational risk, and recommend actions across finance, marketing, and operations.
What Is Predictive Analytics, and Why Do Most Definitions Miss the Point?
Predictive analytics is the use of historical data, statistical algorithms, and machine learning models to assign probability scores to future events. It does not tell you what will happen with certainty. It tells you what is most likely to happen, with what confidence, and what it will cost you if you ignore it.
That last part is where most definitions fall short. Vendors love to describe predictive analytics as a technology. It is actually a financial decision-making system. The model is the mechanism. The output is only as valuable as the action it triggers.
Here is the distinction I come back to with every client evaluation:
| Analytics Type | Core Question | Business Output | Example Tool |
|---|---|---|---|
| Descriptive | What happened? | Historical reports, dashboards | Power BI, Tableau |
| Diagnostic | Why did it happen? | Root cause analysis | SQL drill-downs, BI |
| Predictive | What will happen? | Probability scores, forecasts | DataRobot, Azure ML |
| Prescriptive | What should I do? | Recommended actions, simulations | Agentic AI, Decision platforms |
The enterprise analytics market in 2026 is not debating descriptive versus predictive. The real debate is whether your organization can connect predictive outputs to automated or semi-automated decisions. That is what practitioners call the closed-loop model, and it is where the ROI actually lives.
What Are the Real Benefits of Predictive Analytics?
The core benefits of predictive analytics are lower operational costs, reduced customer churn, faster fraud detection, and better inventory management. These outcomes are measurable within one to two fiscal quarters when the implementation starts from a defined business problem, not from a technology selection.
I want to draw a sharp line between what vendors promise and what grounded implementations actually deliver.
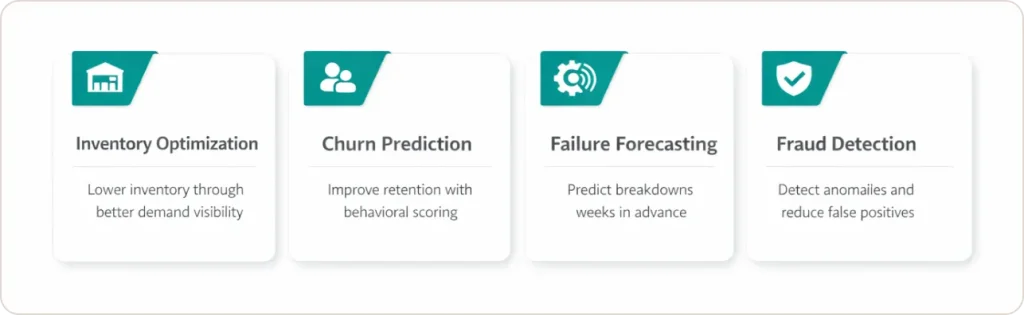
Inventory and operational efficiency. Awe Inspired, a retail client, reached a point where tighter demand visibility through connected reporting directly reduced overall inventory levels and cut the reporting workload by nearly half an FTE. That is not a large-enterprise outcome. That is a mid-market result achieved by fixing the data foundation before touching any predictive model.
Churn reduction in SaaS and retail. Predictive behavioral analytics assigns a probability score to every active customer based on purchase frequency, engagement patterns, and support history. SaaS companies using this model consistently outperform peers on net revenue retention by 15 to 20 percentage points. The model is not magic. It surfaces the signal that human teams cannot process at the account level and at scale.
Equipment failure forecasting in manufacturing. Using ARIMA or LSTM models trained on IoT sensor data, manufacturers can predict component failure 2 to 4 weeks in advance. Reactive maintenance costs 3 to 5x more per incident than scheduled maintenance. The ROI calculation is not complex. The discipline to implement it correctly is where most projects stall.
Fraud detection in financial services. Gradient Boosting models trained on behavioral transaction data catch anomaly patterns that static rule-based systems miss entirely. Banks using ensemble models like Nets Fraud Ensemble report fraudulent transactions dropping by up to 40%, while others achieved 40-54% false positive reductions, improving efficiency and cutting losses.
The common thread across every successful implementation: the model output is wired to a decision or action. Prediction without intervention is expensive foresight and nothing more.
Where Does Predictive Analytics Deliver the Highest ROI by Industry?
Predictive data analytics delivers the strongest measurable ROI in manufacturing, retail, financial services, and healthcare. Each industry applies different model types, but the same principle holds: the higher the cost of a wrong or delayed decision, the higher the return from predicting it correctly.
| Industry | Primary Use Case | Model Type | Documented Outcome |
|---|---|---|---|
| Manufacturing | Equipment failure forecasting | LSTM, ARIMA | 3 to 5x reduction in per-incident maintenance cost |
| Retail / CPG | Churn prediction, demand planning | Random Forest, Logistic Regression | 15 to 20% NRR improvement; reduced carrying costs |
| Financial Services | Fraud detection, credit risk scoring | Gradient Boosting, XGBoost | 20 to 40% fewer false positive fraud flags |
| Healthcare | 30-day readmission risk | Logistic Regression, XGBoost | 10% reduction in readmission rates (Johns Hopkins) |
| Supply Chain | Demand forecasting, supplier risk | ARIMA, Reinforcement Learning | Significant reduction in overstock and stockout events |
Our team works across manufacturing, retail, financial services, and healthcare verticals. The starting point in each case is not a model. It is a clearly defined business problem with a financial baseline.
“We’ve been able to basically decrease the workload of almost half an FTE by now having more direct access to reporting. We’re starting to see a reduction in our overall inventory levels through tighter management.” Tim Eisenmann, COO, Awe Inspired (Source)
How Do You Actually Implement Predictive Data Analytics Services Without Wasting Six Figures?
Implementing predictive data analytics services requires four steps in strict order: build a trusted data foundation, define the financial guardrail for the model, select and train the model against a specific outcome, and close the feedback loop so the model improves with every decision made.
The sequence matters. Most failed implementations skip step two entirely. Teams jump from data availability to model selection without ever answering the question: what financial outcome is this model designed to move, and by how much?
Step 1. Establish a reliable data foundation.
Before any model runs, you need a single, clean, consistent data layer. This means integrating your CRM, ERP, and transactional systems with behavioral and operational signals. Industry analyses indicate 70-85% of AI initiatives fail to meet expected outcomes, with poor data quality frequently cited as a primary cause alongside other factors.
Step 2. Define the Model P&L before writing a line of code.
Every predictive model should have a financial guardrail attached before it is built. Define what direct savings, revenue lift, or risk avoidance the model is expected to generate. Set a minimum acceptable ROI threshold. If the model does not clear the threshold within 90 days of going live, it gets retrained or retired.
The ROI formula is direct:
ROI = (Direct Savings + Revenue Lift + Risk Avoidance) minus Implementation Costs, divided by Implementation Costs, multiplied by 100.
This is how you prevent analytics from becoming a science project with no commercial accountability.
Step 3. Select the model for the problem, not the technology trend.
Random Forest works well for churn and classification problems. ARIMA and LSTM are appropriate for time-series forecasting in manufacturing and supply chains. Gradient Boosting handles fraud and credit risk with high accuracy. The model choice should follow the problem definition, not the other way around. Our data science services cover predictive modeling, prescriptive analytics, and machine learning engineering across these use cases.
Step 4. Close the feedback loop.
This is the most underused capability in predictive analytics implementations, and most vendors will not push you to build it because it requires organizational change, not just software configuration.
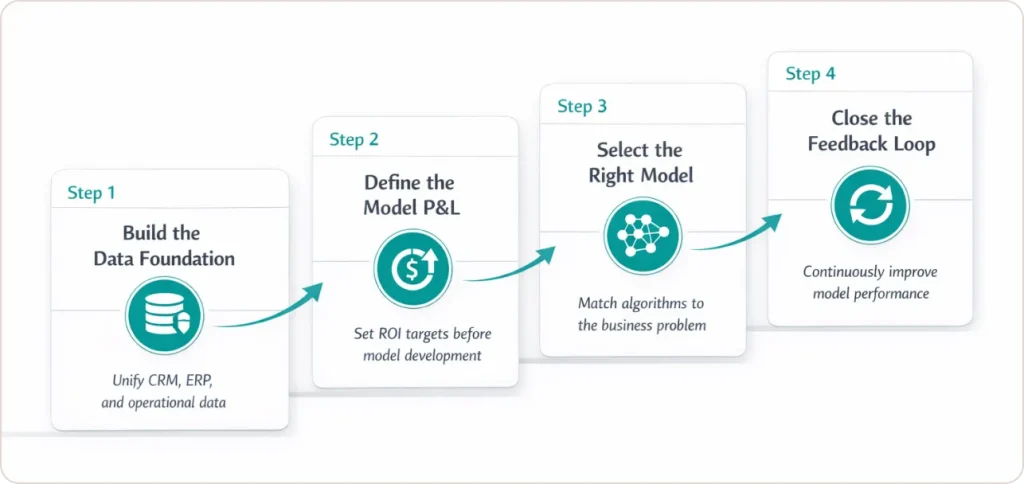
When a churn model recommends an intervention and the sales team acts on it, that outcome (retained or churned) must feed back into the training data. Without this, the model’s accuracy plateaus at its initial performance level. With it, accuracy compounds with every decision cycle. This is what separates a one-time analytics project from a compounding intelligence system.
What Is Predictive Behavioral Analytics and How Does It Apply to Marketing?
Predictive behavioral analytics forecasts individual human actions, including purchase intent, churn likelihood, and content engagement, based on patterns in behavioral data. It differs from aggregate-level predictive analytics by scoring each person individually rather than projecting trend-level outcomes.
For sales and marketing analytics, this shift is significant. Instead of segmenting customers into broad buckets and sending the same offer to everyone in a group, predictive behavioral analytics assigns a real-time probability score to each account or contact. The intervention only fires when the score crosses a defined threshold, which reduces offer spend and increases conversion simultaneously.
A 2021 McKinsey report on personalization found that it most often drives revenue lifts of 10 to 15%, with company-specific results spanning 5 to 25% depending on execution. The practical output: a customer carrying a 76% churn probability score gets flagged for the customer success team before the renewal conversation, not after. That is the difference between reacting and predicting.
The practical application looks like this: customer Z carries a 76% churn probability score based on three consecutive months of declining engagement and two unresolved support tickets. The model triggers an account review task in the CRM and flags the account for the customer success team before the renewal conversation. That is predictive analytics marketing in operation: not a campaign, a precision action.
This is the core capability delivered through supply chain analytics and sales analytics engagements where behavioral signals flow across functions.
How Do Enterprise Predictive Analytics Platforms Compare in 2026?
The right predictive analytics platform depends on your existing data stack, internal technical capacity, and whether you need a managed solution or a self-serve capability. Enterprise-grade platforms like DataRobot and Azure Machine Learning offer the deepest MLOps capabilities. Mid-market and low-code options like Power BI Copilot are viable for organizations without dedicated data science teams.
| Platform | Best For | Technical Bar | Approx. Cost (Annual) | Explainability (XAI) |
|---|---|---|---|---|
| DataRobot | Large enterprise, MLOps automation | High | $100K+ | Yes, built-in |
| Azure ML + Fabric | Microsoft-stack enterprises | Medium-High | $30K+ | Yes (Responsible AI) |
| Snowflake Cortex | Data-first cloud organizations | Medium | Usage-based | Developing |
| Power BI Copilot | Mid-market, low-code needs | Low | $10 to $30/user/month | Partial |
| Akkio | SMBs, non-technical teams | Very Low | $500 to $2,000/month | Limited |
One evaluation criterion most buyers overlook: explainability. If a model makes automated decisions about customers, employees, or credit applicants, current regulatory frameworks, including CCPA, Colorado’s AI Act, and Texas consumer data legislation, increasingly require that those decisions be auditable and explainable. A model that cannot tell you why it scored a customer cannot be defended in a compliance review or trusted enough to act on at scale.
Our team works across the Microsoft and Snowflake ecosystems and helps clients select the right platform architecture based on existing stack and governance requirements. The data analytics services page covers this evaluation process in detail.
Where Should You Start?
The enterprise analytics market has moved past the “should we do this” question. The practical question is whether your organization has the data foundation, the financial guardrail, and the feedback loop in place to make it compound.
Three things to act on before you engage any vendor or platform.
First, audit your data before selecting a platform. If your CRM and ERP are producing inconsistent records, no model can overcome that. The foundation has to be solid. Our data engineering services address this layer directly.
Second, identify one business problem with a clear financial cost of inaction. The highest-value first use case is almost always the decision your team makes manually every week that costs the most when it is wrong. Whether that is churn, equipment failure, or demand planning, define the financial baseline before evaluating any technology.
Third, require explainability from every vendor you evaluate. If the model output cannot be audited, it cannot be trusted at scale, and it cannot survive a compliance review.
If you want to identify your highest-value starting point and map it to a realistic financial outcome, the conversation starts here.