Introduction
Every empty shelf represents more than a lost sale—it’s eroded customer trust that takes years to rebuild. In 2024, global retailers lost $1.7 trillion due to stockouts and overstocks combined, yet most executives can’t answer a simple question: What’s your stockout rate?
Advanced analytics can cut stockouts by 25% through intelligent demand forecasting, real-time inventory visibility, and prescriptive recommendations that tell you exactly what to order, when, and where. After helping dozens of companies optimize their supply chains, I’ve watched businesses transform from reactive firefighting to proactive planning using advanced data analytics and inventory management forecasting strategies.
The Hidden Cost of Stockouts
The damage from stockouts extends far beyond immediate lost revenue. Over 50% of consumers abandon purchases when items aren’t available or delivery is slow. A single negative review about unavailability deters 22% of potential customers, costing businesses an average of $4,400 per incident.
Companies tolerating stockout rates above 5% leave 10-15% of potential revenue on the table annually. For a $50M business, that’s $5-7.5M in recurring losses. Rush orders inflate shipping costs by 30-40%, emergency expediting pulls purchasing teams away from strategic sourcing, and customer service handles complaint calls instead of building relationships.
Why Traditional Methods Fail
Traditional inventory management relies on static models: reorder points based on historical averages, safety stock buffers calculated once annually, and gut-feel adjustments when forecasts miss. These approaches worked when demand was predictable and supply chains stable—but that world no longer exists in 2025.
E-commerce has accelerated SKU proliferation, with retailers now managing 10x more products than a decade ago. Consumer preferences shift weekly, influenced by social media trends that traditional forecasts can’t capture. Spreadsheet-based forecasting cannot process the volume and velocity of data required for accurate predictions, typically resulting in forecast errors of 20-30%.
The Analytics Advantage
Advanced analytics transforms this landscape through predictive modeling, machine learning, and real-time data integration. Research from McKinsey shows AI-driven forecasting can reduce errors by 30-50% compared to traditional methods, with companies improving forecast accuracy from 75% to over 90%.
The transformation isn’t just about better predictions—it’s about speed. Advanced analytics processes signals in real-time: a supplier delay triggers automatic warehouse reallocation, a viral social media post forecasts demand spikes before they hit your POS system, and weather pattern changes adjust inventory before seasonal shifts arrive.
How Advanced Analytics Works for Inventory Management
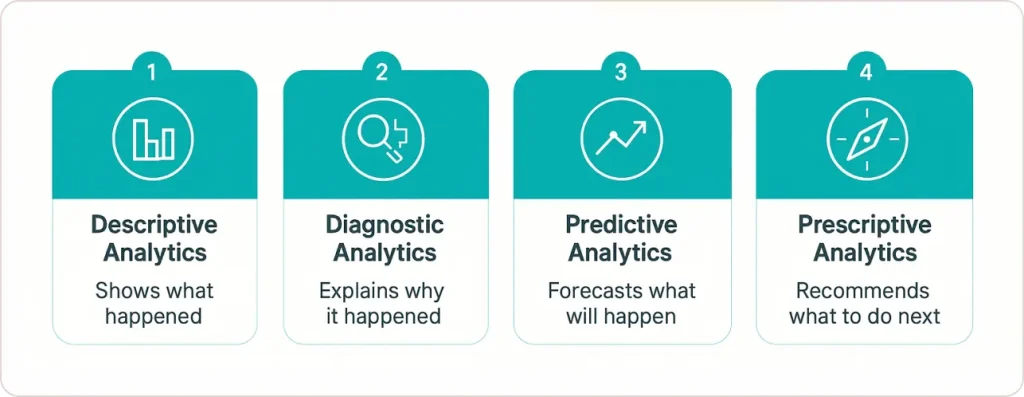
Inventory management predictive analytics encompasses four progressive capabilities that drive the 25% stockout reduction:
Descriptive Analytics: Reports what happened—your stockout rate was 8% last quarter
Diagnostic Analytics: Explains why—poor forecast accuracy on seasonal items caused 60% of incidents
Predictive Analytics: Forecasts what will happen—demand for Product X will spike 35% in two weeks
Prescriptive Analytics: Recommends what to do—increase Product X order quantity by 200 units and reallocate 150 units from Warehouse B to Warehouse A
Most businesses remain stuck at descriptive or diagnostic levels. The 25% reduction happens when you implement predictive and prescriptive capabilities simultaneously.
The Four Pillars of Success
1. Unified Real-Time Data Integration
You cannot optimize what you cannot see. Advanced analytics demands breaking down data silos across e-commerce platforms, ERP systems, marketing automation, and supply chain management tools. Create a single source of truth showing inventory status, sales velocity, and marketing campaign performance in one unified view.
2. AI-Powered Predictive Models
Machine learning algorithms process dozens of variables simultaneously—historical sales patterns, seasonality, promotional calendars, competitor pricing, economic indicators, weather forecasts, and social media sentiment. These predictive analytics for inventory optimization models identify patterns invisible to human analysts.
One distribution client saw 40% reduction in seasonal stockouts after incorporating Google Trends data into forecasts. The algorithm detected search volume increases 3-4 weeks before corresponding sales spikes, giving procurement enough lead time to adjust orders.
3. Prescriptive Decision Automation
Prediction alone doesn’t solve stockouts—you need automated action. When demand exceeds forecast by 20%, prescriptive systems automatically adjust reorder points, trigger expedited orders if lead time is insufficient, reallocate inventory from lower-velocity locations, and alert category managers to investigate demand drivers.
4. Intelligent Alerts and Dashboards
Analytics must be accessible for adoption. Build dashboards providing at-a-glance inventory health metrics: stockout rate, days of inventory on hand by category, forecast accuracy trend, and inventory turnover velocity. Intelligent alerts notify stakeholders only when action is required, ensuring focus on exceptions rather than drowning in data.
Five Proven Strategies to Reduce Stockouts
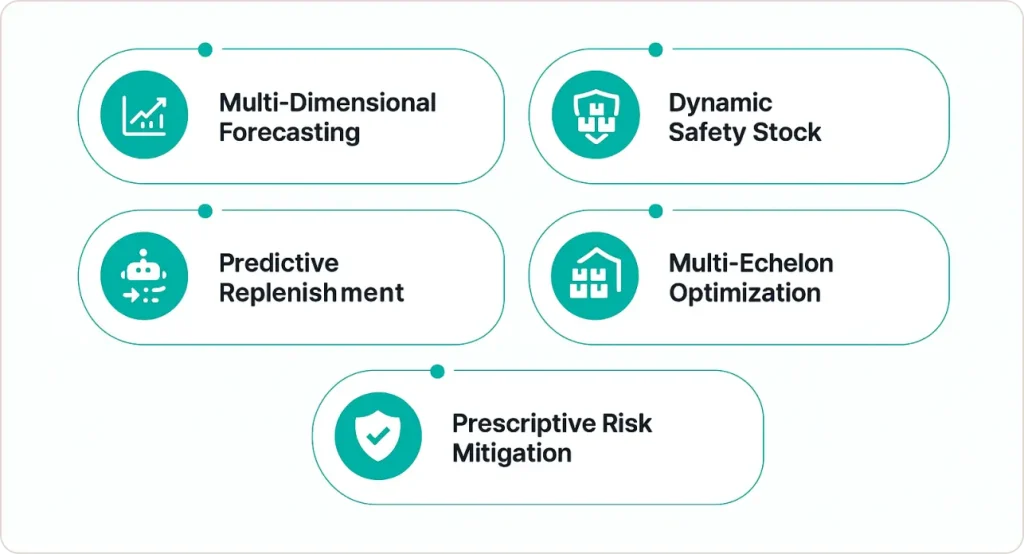
Strategy 1: Multi-Dimensional Demand Forecasting
Traditional forecasting uses univariate time series—projecting past sales forward. Advanced analytics employs multi-dimensional modeling incorporating external variables most businesses ignore:
- Web analytics signals: Product page view velocity, cart abandonment patterns, search query trends
- Marketing campaign data: Promotional timing, channel mix, historical response rates
- Competitive intelligence: Competitor pricing changes, stock availability, promotional activity
- Macroeconomic indicators: Consumer confidence index, unemployment rates, fuel prices
- Weather and seasonal patterns: Localized forecasts affecting specific product categories
One beverage distributor reduced spoilage by 20% and stockouts by 30% by incorporating real-time weather data. When forecasts predicted heatwaves, the algorithm automatically increased cold beverage orders while reducing hot beverage stock.
Companies typically move from 70-75% forecast accuracy to 90-95%, eliminating the majority of surprise stockouts.
Strategy 2: Dynamic Safety Stock Optimization
Safety stock is expensive insurance. Most businesses calculate it once annually using static formulas, then forget about it. This approach either over-protects (tying up capital) or under-protects (causing stockouts when demand variability increases).
Advanced data analytics enables inventory reductions of 20-30% through improved demand forecasting and optimization. Systems recalculate optimal safety stock continuously based on demand variability trends, supplier reliability metrics, service level targets, and working capital constraints.
The key insight: not all SKUs require equal protection. High-margin, fast-moving items justify tighter safety stock; low-margin, slow-movers don’t. This approach reduces total inventory by 15-20% while simultaneously decreasing stockouts.
Strategy 3: Predictive Replenishment Automation
Manual reordering introduces delay and error. Advanced analytics enables automated replenishment that orders precisely what’s needed, when it’s needed. The system continuously monitors current inventory levels across all locations, real-time sales velocity and demand forecasts, supplier lead times and reliability, promotional calendars and expected spikes, and inventory in-transit status.
When inventory projections indicate stockout risk within the supplier lead time window, the system automatically generates purchase orders. For one manufacturing client, this automation reduced stockout incidents by 35% while cutting purchasing department workload by nearly half an FTE, eliminating over-ordering driven by planner anxiety and reducing excess inventory by 20-25%.
Strategy 4: Multi-Echelon Inventory Optimization
For businesses with multiple warehouses or distribution centers, advanced analytics optimizes inventory allocation across the entire network. This determines how much inventory to hold at each node to minimize total system cost while meeting service level targets.
A retailer operating 12 regional warehouses serving 200+ stores discovered significant inefficiencies through multi-echelon optimization: some regions were chronically overstocked while others faced frequent stockouts due to demand volatility differences. The optimized allocation strategy reduced total network inventory by 18% while improving aggregate fill rates from 89% to 96%.
Strategy 5: Prescriptive Risk Mitigation
Supply chain disruptions have highlighted the critical need for businesses to improve planning to be more agile and resilient. Predictive inventory management identifies and mitigates supply chain risks before they cause stockouts by monitoring supplier risk indicators, logistics disruptions, and demand volatility signals.
When risks materialize, prescriptive recommendations suggest mitigation actions: qualify backup suppliers, expedite at-risk orders, increase safety stock temporarily, or shift demand through pricing adjustments. One electronics retailer avoided major stockouts during a supplier bankruptcy by receiving early warning alerts that triggered qualification of alternate suppliers two months before the event.
Real Implementation Success

An e-commerce retailer in the outdoor gear sector implemented comprehensive advanced analytics following this framework and achieved transformative results within six months:
Results Achieved:
- 25% reduction in stockout incidents on top 100 SKUs
- 15% sales growth by maintaining product availability when customers wanted them
- 10% decrease in overall inventory levels through tighter demand forecasting
- 50% reduction in manual reporting time, freeing purchasing teams for strategic work
- Forecast accuracy improvement from 30% error to under 12%
The COO’s testimonial captured the transformation: “We’re starting to see a reduction in our overall inventory levels through tighter management. For the first time, we have confidence in our numbers.”
Your Implementation Roadmap
Step 1: Establish Your Baseline (2-4 weeks)
Measure stockout frequency, assess forecast accuracy using Mean Absolute Percentage Error (MAPE), evaluate inventory efficiency through turnover and days on hand calculations, identify data gaps across systems, and quantify annual lost revenue from stockouts plus excess inventory carrying costs.
Step 2: Integrate Your Data Sources (6-12 weeks)
Create a single source of truth integrating POS or e-commerce transaction data, inventory levels across all locations, purchase orders and supplier lead times, marketing campaign calendars and spend, customer behavior data, and external signals like market trends and weather.
For mid-market businesses, cloud data warehouses like Snowflake or BigQuery with integration platforms work well. The key is real-time or near-real-time data flow—batch processes that run weekly won’t support proactive decision-making.
Step 3: Deploy Predictive Models (8-16 weeks)
Choose between packaged inventory optimization software (Netstock, ToolsGroup, Blue Yonder), modern ERP modules (NetSuite, SAP), or custom machine learning models for unique business requirements. Ensure your solution provides SKU-level demand forecasts with confidence intervals, automatic reorder point calculations, scenario simulation capabilities, integration with purchasing systems, and user-friendly dashboards.
Step 4: Redesign Processes and Train Teams
Technology alone doesn’t eliminate stockouts. Define how forecasts inform purchasing decisions, train planners and buyers to understand and trust analytics tools, start with a pilot product category before scaling, create feedback loops to refine models when forecasts miss, and celebrate early wins to build organizational momentum.
Step 5: Monitor and Iterate Continuously
Companies have reaped major benefits including higher revenue and customer retention with analytics inventory management approaches. Track KPIs weekly: stockout rate, forecast accuracy, inventory turnover, fill rate, and working capital. Retrain algorithms quarterly to capture changing patterns, add new data sources to improve predictions, expand scope to supplier risk monitoring or dynamic pricing, and set annual improvement targets.
The most successful organizations treat inventory analytics as a strategic capability, investing continuously rather than viewing it as a one-time technology deployment.
Conclusion
Advanced analytics represents the most significant competitive advantage available for inventory management and forecasting today. Prevent 25% of stockouts and you recapture millions in lost revenue while simultaneously reducing working capital tied in excess inventory.
Beyond financial metrics, customers experience higher product availability building loyalty and repeat purchases. Operations teams shift from reactive firefighting to proactive planning. Purchasing functions make data-driven decisions instead of guessing. Executive teams gain visibility and confidence in inventory investments.
The businesses winning in 2025 and beyond won’t be those with the biggest budgets—they’ll be those leveraging data and analytics to operate smarter. While competitors struggle with stockouts and excess inventory, you’ll maintain optimal availability at minimum cost. Organizations implementing AI-powered retail analytics are already seeing transformative results across demand forecasting, inventory optimization, and customer experience enhancement.