Key Highlights:
• Data silos cost 20% potential revenue
• Bad data quality kills AI and personalization
• Most retailers can’t track true customer lifetime value
• Privacy mistakes average $3.48M in damages
• 70% lack unified view across sales channels
Introduction
“Your POS says you’re profitable, but your gut says you’re bleeding money.”
Last week, I got a call from Maria, who owns three boutique locations in Texas. She was frustrated because her “bestselling” jacket kept selling out, but when she ordered more, they sat unsold for months. Her POS system showed strong sales, her e-commerce platform had different numbers, and her inventory spreadsheet? Complete chaos.
Maria’s situation perfectly illustrates the paradox facing modern retailers: we have more customer data than ever before, yet we’re making critical business decisions based on incomplete information. Most retail industry challenges 2025 aren’t about competition or rent costs, they’re about making sense of the information you already have. These retail challenges affect everyone from single-store boutiques to multi-location chains.
After working with hundreds of retailers across the US, I’ve identified the core data problems that separate thriving businesses from struggling ones. Here’s what’s really holding retailers back, and how to fix it.
The Core Problem: Your Data Lives in Isolation
Systems That Don’t Communicate
Walk me through your typical Tuesday. A customer buys something online, picks it up in-store, then posts about it on Instagram. Simple transaction, right?
Wrong. That single customer journey probably created records in four different systems:
- Your e-commerce platform logged the sale
- Your POS system recorded the pickup
- Your email tool has their subscription data
- Your social media shows their engagement
These retail analytics challenges happen because most businesses lack retail data integration solutions. The real cost? You can’t answer basic questions like “Which customers are most valuable?” or “What products actually drive repeat business?”
I recently worked with a retailer who discovered they were sending “come back” emails to customers who’d shopped three times that month. Their email system couldn’t see in-store purchases. This is exactly how big data problems are solved in the retail sector, by connecting these isolated systems.
The financial impact: If you can’t track cross-channel customer behavior, you’re treating online and offline customers as completely different people. A customer who spends $2,000 annually might appear as a $300 online customer and a $1,700 in-store customer in your systems.
The Quick Fix Framework
Here’s how to connect your systems:
- Start with your two biggest data sources (usually POS and e-commerce)
- Use customer email as the connection point (most reliable identifier)
- Test with 100 customers before rolling out to your entire database
- Measure success by tracking unified customer profiles
Tools that work: Zapier for simple connections, customer data platforms like Segment, or custom data analytics services when your tech stack needs something more tailored.
The Quality Crisis: When “Clean” Data Is Actually Garbage
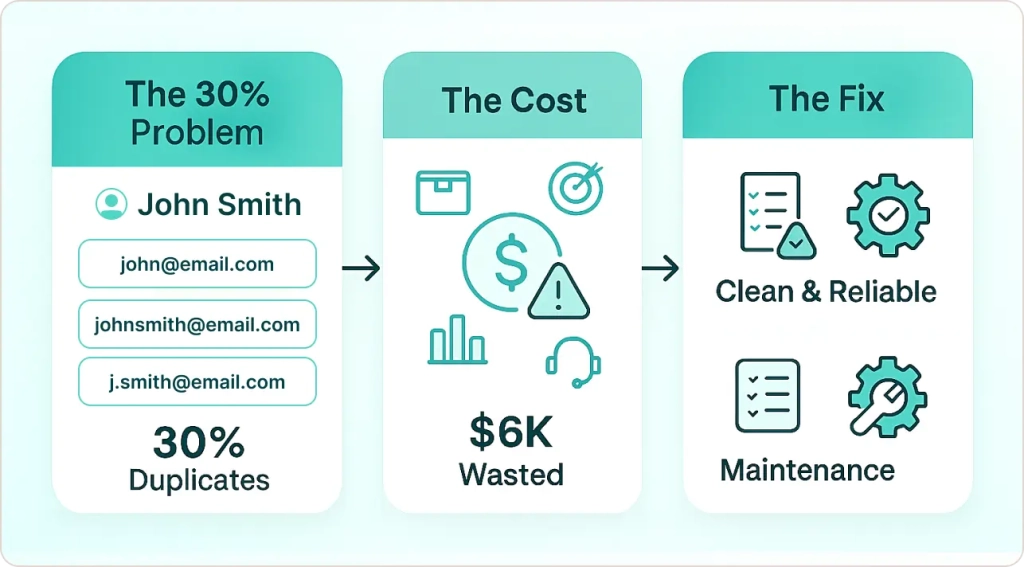
The 30% Problem
Here’s what I find in most retail databases:
- John Smith (john@email.com)
- Jon Smith (johnsmith@email.com)
- J. Smith (j.smith@email.com)
Same person, three records. I’ve seen retailers with 30% duplicate customer data. These data quality issues in retail create a cascade of problems:
The immediate damage: A client spent $15,000 on email marketing last year, but 40% went to duplicate or invalid addresses. That’s $6,000 literally thrown away.
The hidden costs:
- Inventory reports that don’t match reality
- Marketing campaigns hitting wrong segments
- Customer service confusion from conflicting records
- Analytics that mislead rather than guide
Data Quality Solutions That Work
Monthly maintenance routine:
- Run duplicate detection using your email platform’s built-in tools
- Validate addresses before adding to customer database
- Standardize product names (create a style guide)
- Train staff on consistent data entry (15 minutes saves hours)
Automation fixes:
- Set validation rules for email formats and phone numbers
- Use address verification tools for shipping data
- Implement automatic duplicate merging where possible
- Create alerts for unusual data patterns
The Analytics Gap: Having Data vs. Using Data
The Dashboard Paradox
Your analytics show a 15% increase in “sessions” and a 3% drop in “conversion rate.” What does that actually mean for your business? Should you celebrate or panic?
I’ve seen retailers with expensive analytics setups who still make inventory decisions based on “what feels right.” The problem isn’t the technology, it’s translating data into decisions.
The terminology trap: Analytics platforms love jargon that intimidates business owners. When people don’t understand metrics like “bounce rate” or “attribution models,” they ignore them entirely.
The action gap: Even when you understand the numbers, knowing what to do about them isn’t obvious. A report showing mobile users abandon carts more frequently doesn’t automatically tell you how to fix it.
Making Analytics Actionable
Focus on metrics that drive decisions:
- Customer lifetime value (guides marketing spend)
- Inventory turnover (prevents cash flow problems)
- Channel attribution (shows which marketing works)
- Seasonal patterns (improves planning accuracy)
Create decision triggers:
- If inventory drops below X units → automatic reorder
- If email open rates fall below Y% → test new subject lines
- If mobile conversion drops → review checkout process
Weekly data check-ins: Pick one insight per week and take action. Build the habit before expanding to complex analysis.
The Human Challenge: Skills and Change Management
The Talent Reality
Most retail businesses can’t afford a $75,000 data analyst, but they desperately need analytics expertise. This creates a skills gap that leaves valuable data unused.
The training challenge: Your store manager already works 50+ hours weekly. When will they learn statistical analysis or SQL?
Practical solutions:
- Start with user-friendly tools that don’t require coding
- Partner with analytics consultants for project-based needs
- Focus on one person becoming proficient rather than training everyone
- Use automated insights that generate plain-English explanations
Overcoming Data Resistance
Cultural barriers: “We’ve always done it this way” is the enemy of data-driven retail. Experienced staff often trust intuition over analytics, especially when data contradicts their experience.
Building confidence: Start with small, low-risk decisions where data clearly provides value. Success breeds willingness to trust analytics for bigger decisions.
The framework: Connect every data insight to revenue impact. Teams embrace analytics when they see direct business benefits.
Privacy and Security: The $3.48M Risk
The Small Business Reality
Data breaches aren’t just Fortune 500 problems. A client’s small chain got hit with a $45,000 fine for poor password practices. The average retail data breach costs $3.48 million, but for small businesses, even smaller incidents can be devastating.
Common vulnerabilities:
- Weak passwords across business systems
- Unencrypted customer data storage
- Staff clicking phishing emails
- Outdated software with security holes
- Poor access controls for sensitive information
Essential Security Measures
Non-negotiable basics:
- Multi-factor authentication on all business accounts
- Regular password updates using a password manager
- Encrypted data storage for customer information
- Staff training on phishing recognition
- Regular backups stored separately from main systems
Compliance requirements:
- Clear privacy policies explaining data collection
- Easy opt-out processes for marketing
- Data deletion procedures for customer requests
- Regular compliance audits to catch issues early
Measuring Success: ROI That Matters
Track the Right Metrics at the Right Time
Immediate improvements (1-3 months):
- Email marketing performance gains
- Report generation time savings
- Inventory accuracy improvements
- Customer service efficiency
Long-term benefits (6+ months):
- Customer lifetime value increases
- Market share growth
- Profit margin expansion
- Competitive advantage sustainability
Real Results From Real Retailers
Clothing boutique chain (3 locations):
- Problem: Customer data scattered across systems
- Solution: Unified customer profiles
- Result: 28% increase in repeat purchases within 4 months
- Investment: $3,200 setup, $200/month ongoing
Home goods retailer:
- Problem: Seasonal inventory guesswork
- Solution: Data-driven demand forecasting
- Result: 40% reduction in clearance markdowns
- Investment: $5,000 consultant, $400/month software
Electronics store:
- Problem: Couldn’t track online-to-offline journeys
- Solution: Connected customer data across channels
- Result: 25% improvement in email ROI, 12% increase in cross-sells
- Investment: $2,800 integration, $150/month maintenance
Your 90-Day Action Plan
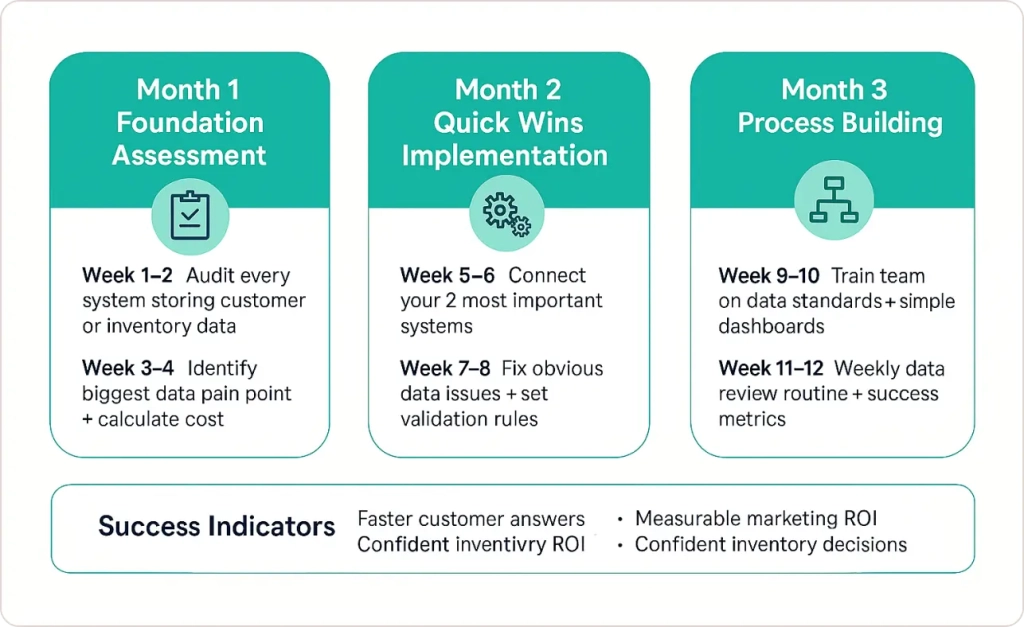
Month 1: Foundation Assessment
Week 1-2: Audit every system storing customer or inventory data
Week 3-4: Identify your biggest data pain point and calculate its cost
Month 2: Quick Wins Implementation
Week 5-6: Connect your two most important systems
Week 7-8: Clean obvious data quality issues and set validation rules
Month 3: Process Building
Week 9-10: Train team on data standards and create simple dashboards
Week 11-12: Establish weekly data review routine and success metrics
Success indicators: You’ll know it’s working when you can answer customer questions immediately, your marketing ROI improves measurably, and inventory decisions feel confident rather than stressful.
The Bottom Line: Data Advantage Is Real
The retailers winning in 2025 aren’t necessarily the biggest or best-funded. They’re the ones who can answer basic questions about their customers and inventory without guessing.
Your competitors are probably struggling with the same data challenges you are. The difference? Some are doing something about it while others remain stuck in spreadsheet hell.
After 50,000+ hours helping businesses turn data chaos into competitive advantages, I can tell you this: modern retail data solutions exist, the tools are affordable, and the ROI is measurable. What’s missing is usually execution.
Whether you need help connecting disconnected systems, implementing retail data integration solutions, or training your team to make data-driven decisions, the path forward is clearer than you think.
Ready to stop guessing about your business and start knowing? Let’s talk about turning your retail data analytics solutions into measurable growth.