Key Highlights:
- Modern retail demand forecasting reduces inventory costs by 20-35% and prevents 65% of stockouts through AI-powered predictions
- Implementation takes 3-6 months with proper planning, starting with clean data and clear business objectives
- 77% of retail executives now prioritize demand planning in retail tools, making 2025 a critical year for adoption
- Success depends on choosing the right approach for your product mix, not the most sophisticated ai for demand forecasting technology
Ever walked into your favorite store only to find that must-have item out of stock? Or noticed clearance racks overflowing with products nobody wanted? These scenarios represent billions in lost revenue and frustrated customers—problems that effective retail demand forecasting solves.
Your inventory is either your biggest asset or your biggest liability. The difference? Knowing what customers will buy before they know it themselves.
I’ve spent the last decade helping retailers transform their inventory nightmares into predictable, profitable operations through data-driven demand forecasting strategies.
After helping 200+ retailers implement demand forecasting systems, I’ve learned that successful forecasting isn’t about perfect predictions—it’s about being consistently less wrong than your current method.
Quick Answer:
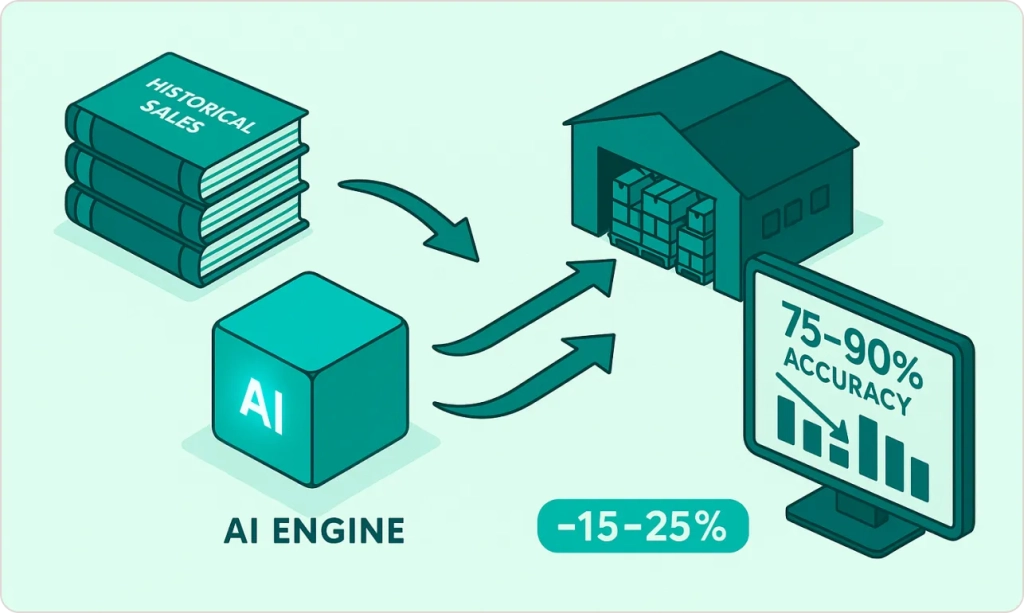
Retail demand forecasting uses historical sales data and predictive models to reduce inventory costs by 15-25% within 12 months. Modern implementations combine statistical methods with machine learning to achieve 75-90% accuracy while preventing stockouts and eliminating excess inventory through automated, data-driven purchasing decisions.
What Retail Demand Forecasting Actually Solves
Retail demand forecasting answers one critical question: how much of each product should you have in stock to maximize profit while minimizing risk?
But here’s what most retail demand forecasting guides won’t tell you: perfect retail demand forecasting doesn’t exist. What matters is being consistently more accurate than your current method. If you’re using gut feelings and last year’s sales, even basic statistical methods will transform your business.
The Real Impact of Retail Demand Forecasting
- Inventory optimization: Right products, right quantities, right time
- Cash flow improvement: Less money tied up in slow-moving stock
- Customer satisfaction: Products available when customers want them
- Margin protection: Fewer emergency orders and markdowns
The goal isn’t to predict the future perfectly. It’s to make inventory decisions with data instead of intuition, reducing both stockouts and excess inventory.
Key benefits include:
- 15-25% reduction in inventory carrying costs
- 10-30% improvement in service levels
- 20-40% fewer emergency orders and expedited shipments
- Better cash flow from reduced dead stock
Consider this: Walmart’s ai powered demand forecasting tools system processes weather patterns, historical sales, and local demographics to position holiday items across 4,700 stores. The result? 15% fewer out-of-stocks during peak periods and significantly higher customer satisfaction scores.
Why Traditional Forecasting Methods Fail
Most retailers still use last year’s sales or simple averages to predict demand. These methods worked when customer behavior was predictable and supply chains were stable.
Today’s retail environment breaks traditional forecasting:
Omnichannel complexity – Customers research online, buy in-store, and return via mobile. Traditional models can’t track these interconnected behaviors.
Shorter product lifecycles – Fashion retailers launch new styles every 4-6 weeks. Historical data becomes irrelevant quickly.
Supply chain volatility – A factory closure in Bangladesh or a port strike in Long Beach can trigger demand shifts that simple models miss.
Social media influence – A TikTok trend can drive 300% demand spikes in 48 hours, then disappear completely.
Modern forecasting methods handle these complexities by processing multiple data sources simultaneously and adapting to changing patterns automatically.
Choose Your Retail Demand Forecasting Approach: The Decision Tree
Not all products need the same demand planning in retail sophistication. Here’s how to decide based on proven retail analytics methodologies:
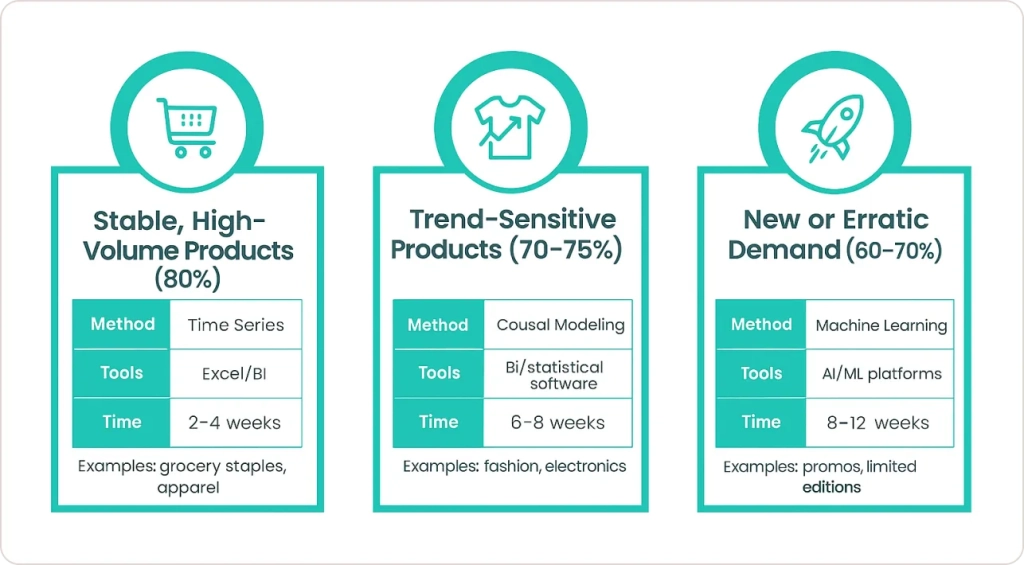
For Stable, High-Volume Products (80% accuracy target)
Best method: Time series analysis (seasonal decomposition) Tools needed: Excel with forecasting add-ins or basic BI tools Implementation time: 2-4 weeks Example: Grocery staples, basic apparel, household goods
For Trend-Sensitive Products (70-75% accuracy target)
Best method: Causal modeling with external data Tools needed: Statistical software or advanced BI platforms Implementation time: 6-8 weeks Example: Fashion items, electronics, seasonal goods
For New Products or Erratic Demand (60-70% accuracy target)
Best method: Machine learning with similarity analysis Tools needed: ai ml demand forecasting platforms Implementation time: 8-12 weeks Example: Limited editions, new categories, promotional items
The 4 Essential Forecasting Methods for Retailers
Choose your approach based on product characteristics and data availability, not marketing hype from software vendors.
Method 1: Statistical Forecasting
Best for: Stable products with 12+ months of sales history Accuracy target: 75-85% Examples: Basic apparel, household goods, grocery staples
Uses mathematical models like exponential smoothing and seasonal decomposition to identify trends and patterns. Works well for products where external factors have minimal impact.
Pros: Simple to understand, quick to implement, requires minimal data Cons: Struggles with new products, ignores external influences, reactive to sudden changes
Method 2: Causal Modeling
Best for: Products influenced by external factors Accuracy target: 70-80% Examples: Seasonal items, weather-dependent products, promotional goods
Incorporates external variables like weather, economic indicators, or marketing spend alongside historical sales data.
Pros: Handles external influences, good for promotional planning, explains demand drivers Cons: Requires more data sources, complex to validate, needs regular model updates
Method 3: Machine Learning Forecasting
Best for: Large product catalogs with complex demand patterns Accuracy target: 75-90% Examples: E-commerce retailers, fashion brands, electronics
Uses algorithms that automatically identify patterns and relationships across multiple data sources without manual specification.
Pros: Handles complexity automatically, improves over time, processes large datasets Cons: Requires significant data, difficult to interpret, expensive to implement
Method 4: Collaborative Forecasting
Best for: Products with strong supplier relationships Accuracy target: 65-75% Examples: Private label goods, exclusive partnerships, custom manufacturing
Combines retailer sales data with supplier production schedules, raw material costs, and market intelligence.
Pros: Incorporates supply-side information, improves supplier relationships, handles disruptions better Cons: Requires data sharing agreements, depends on partner cooperation, slower to implement
Tool Comparison: What Actually Works in 2025
I’ve implemented most major forecasting platforms. Here’s what you need to know:
Enterprise Solutions ($50K+ annually)
Blue Yonder (formerly JDA)
- Strengths: Proven at scale, strong retail focus, excellent support
- Weaknesses: Expensive, long implementation, requires dedicated team
- Best for: Large retailers with complex hierarchies
Oracle Retail Demand Forecasting
- Strengths: Integrates with Oracle ecosystem, solid statistical foundation
- Weaknesses: Limited machine learning, requires Oracle infrastructure
- Best for: Existing Oracle customers
- Strengths: Real-time processing, collaborative planning, modern interface
- Weaknesses: Newer platform, fewer implementation partners
- Best for: Fashion and CPG brands
Mid-Market Solutions ($10K-50K annually)
- Strengths: Flexible modeling, cloud-native, good visualization
- Weaknesses: Requires modeling expertise, can become complex
- Best for: Growing retailers with planning teams
- Strengths: Quick deployment, retail-specific features, reasonable cost
- Weaknesses: Limited customization, basic machine learning
- Best for: Mid-size retailers wanting quick results
Small Business Solutions (Under $10K annually)
Microsoft Power BI + Forecasting
- Strengths: Low cost, familiar interface, easy integration
- Weaknesses: Basic functionality, limited automation
- Best for: Small retailers with Excel-based processes
For retailers already using Microsoft tools, our Power BI consulting services can help implement forecasting capabilities within your existing ecosystem.
Tableau with Forecasting Extensions
- Strengths: Excellent visualization, statistical functions
- Weaknesses: Requires manual model building, limited automation
- Best for: Retailers with data analysis teams
The 90-Day Retail Demand Forecasting Implementation Framework
This timeline delivers measurable results without overwhelming your team. I’ve used this framework with retailers from $10M to $2B in annual revenue.
Phase 1: Foundation (Days 1-30)
Week 1: Data Quality Assessment Audit your current data infrastructure. Poor data quality kills even the best forecasting models.
Essential requirements:
- 18+ months of daily sales data
- Complete product hierarchy (category → subcategory → style → SKU)
- Promotional calendar with discount depths and durations
- Inventory records including stockout dates
- Price change history
Week 2: Business Rules Definition Document constraints that models must respect:
- Minimum order quantities and pack sizes
- Lead times by supplier and product category
- Shelf life and seasonality restrictions
- Promotional planning cycles
Week 3: Current State Analysis Establish baseline performance using your existing methods:
- Calculate forecast accuracy for the past 12 months
- Identify products with highest forecast errors
- Document manual override frequency and reasons
- Measure current inventory turnover by category
Week 4: Pilot Product Selection Choose 25-50 representative SKUs across different categories:
- High-velocity items (prove ROI quickly)
- Seasonal products (test complexity handling)
- New launches (validate similarity algorithms)
- Promotional items (test event modeling)
Phase 2: Model Development (Days 31-60)
Week 5-6: Statistical Baseline Build simple models to establish minimum performance standards:
- Moving averages (4, 8, 12-week periods)
- Exponential smoothing with trend and seasonality
- Last year same period adjusted for growth
Week 7-8: Advanced Models Develop sophisticated approaches based on your data:
- ARIMA models for trending products
- Seasonal decomposition for cyclical items
- Regression models incorporating external factors
- Machine learning models if data volume supports it
Test all models using historical data, never judge performance on training data.
Phase 3: Validation and Deployment (Days 61-90)
Week 9-10: Model Validation Compare model performance using out-of-sample testing:
- Hold out the most recent 13 weeks of data
- Generate forecasts using only older data
- Measure accuracy against actual sales
- Select best-performing model for each product category
Week 11-12: System Integration and Training Connect forecasting outputs to existing systems:
- ERP integration for automatic purchase order generation
- Inventory management system updates
- Exception reporting for unusual predictions
- User training on interpretation and override procedures
For retailers needing comprehensive data analytics services to support forecasting implementation, we provide end-to-end data infrastructure setup and integration.
Industry Expert Insight
“Retailers who master demand forecasting gain sustainable competitive advantages through better inventory management and customer satisfaction,” notes Gartner’s latest retail technology research.
Explores the growing complexity of retail demand forecasting in today’s evolving market. It highlights how customer behaviors, purchasing channels, and fulfillment preferences have become more dynamic, making accurate forecasting more challenging than ever.
Real Success: Beyond the Hype
Fashion Retailer: 150 Stores, $85M Revenue
Challenge: 40% of inventory required markdowns, seasonal buying decisions made 6 months in advance
Solution: Implemented seasonal forecasting with trend analysis and social media sentiment tracking
Results after 12 months:
- Reduced markdowns from 40% to 18% of inventory
- Improved full-price sell-through by 23%
- Decreased working capital requirements by $2.1M
Key insight: They focused on forecasting by style-color-size combination rather than total units, revealing that demand patterns varied significantly within product families.
Source: Fashion Retail Demand Forecasting Study – Springer Operations Research
Grocery Chain: 45 Locations, Focus on Fresh Products
Challenge: 12% waste rate on fresh produce, frequent stockouts on high-velocity items
Solution: Daily forecasting integrated with local weather data and promotional calendars
Results after 8 months:
- Reduced produce waste from 12% to 7%
- Improved fresh product availability by 15%
- Generated $340K additional gross profit annually
Key insight: Daily forecasting proved essential for perishables, while weekly forecasting worked fine for packaged goods.
Source: Grocery Supply Chain Analytics Research – International Journal of Production Economics
For retailers in similar situations, our retail analytics solutions provide industry-specific expertise in demand forecasting implementation.
Learn how other retailers achieved 20-35% inventory cost reductions and improved forecast accuracy.
Measuring Success: Metrics That Matter in Retail Demand Forecasting
Forget about forecast accuracy percentages—focus on business impact from your demand forecasting in retail industry efforts:
Primary Metrics
- Inventory turns: Should improve 15-25% in year one
- Service levels: Maintain or improve while reducing stock
- Gross margin: Track markdown reduction and full-price sell-through
Secondary Metrics
- Forecast bias: Consistent over/under forecasting patterns
- Mean Absolute Percentage Error (MAPE): By product category
- Forecast value added: Comparing your method to naive approaches
Setting Realistic Expectations for Retail Demand Forecasting
According to Tredence’s analysis, retailers implementing ai ml demand forecasting typically see:
- Month 1-3: 5-10% improvement in forecast accuracy
- Month 4-6: 15-20% improvement with process refinements
- Month 7-12: 20-35% improvement as machine learning models mature
Don’t expect miracles immediately. The biggest gains come from consistent process improvement, not perfect algorithms.
Common Implementation Pitfalls (And How to Avoid Them)
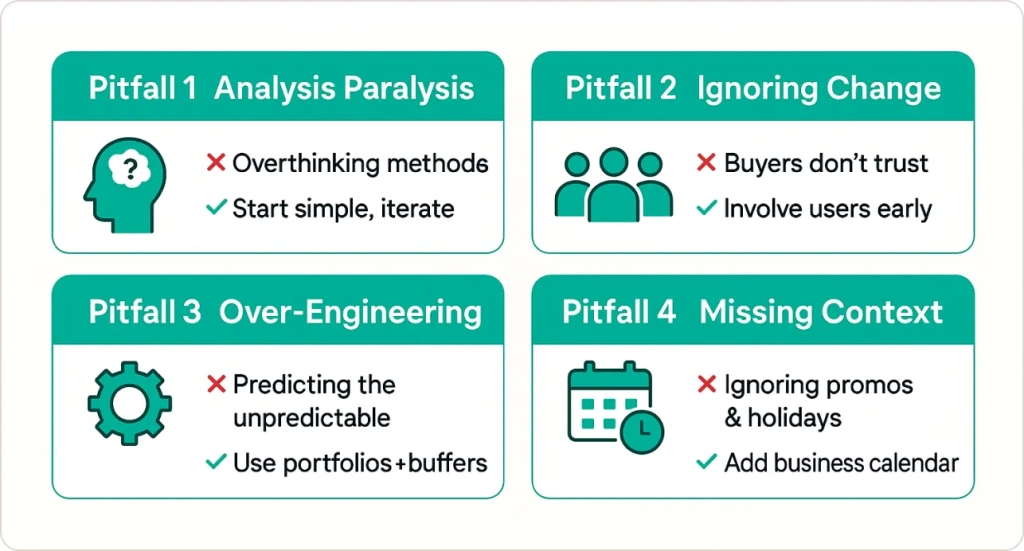
Pitfall 1: Analysis Paralysis
The problem: Spending months comparing demand planning in retail methods The solution: Start simple, improve iteratively
Pitfall 2: Ignoring Organizational Change
The problem: Building great retail demand forecasting models that buyers don’t trust The solution: Involve users in model selection and validation
Pitfall 3: Over-Engineering New Product Forecasting
The problem: Trying to predict unpredictable items with retail demand forecasting The solution: Use portfolio approaches and safety stock strategies
Pitfall 4: Forgetting External Factors
The problem: Models that ignore promotions, holidays, and competition The solution: Build business calendar into retail demand forecasting process
When to Upgrade Your Current Approach
Evaluate your forecasting maturity annually using these triggers:
Upgrade if you experience:
- Forecast accuracy consistently below 70% for core products
- Manual overrides happening more than 40% of the time
- Inventory turnover declining year-over-year
- Frequent stockouts impacting customer satisfaction
- Expanding into new markets or product categories
Stay with current approach if:
- Accuracy improvements have plateaued at acceptable levels
- Team is still mastering current tools
- Business priorities focus on other initiatives
- Recent implementation hasn’t had time to mature
Advanced Strategies for Competitive Advantage
Demand Sensing
Process real-time signals like point-of-sale data, social media mentions, and search trends to detect demand changes within days instead of weeks.
Implementation: Start with your top 20% of SKUs by revenue ROI timeline: 3-6 months for meaningful impact Technology requirements: Real-time data feeds, automated model updating
Scenario Planning
Model multiple demand scenarios instead of single-point forecasts:
- Optimistic (high growth)
- Base case (expected performance)
- Pessimistic (market downturn)
This approach improves risk management and inventory planning flexibility.
Price-Demand Integration
Link forecasting models to dynamic pricing systems. As demand predictions change, pricing adjusts automatically to optimize revenue.
Best for: Fast-moving consumer goods, seasonal products Complexity level: High (requires advanced analytics team) Payback period: 6-12 months
Transform Your Retail Operations with Expert Demand Forecasting
Retail demand forecasting represents the difference between reactive inventory management and proactive business strategy. The convergence of advanced analytics capabilities, affordable technology, and competitive pressures creates unprecedented opportunities for retailers ready to embrace data-driven decision making.
The window for gaining competitive advantage through superior demand forecasting is narrowing. Companies implementing systematic approaches now will establish market advantages that become increasingly difficult for competitors to replicate.
Key success factors include:
- Starting with clean, comprehensive data foundation
- Matching forecasting methods to product characteristics
- Focusing on business outcomes over technical perfection
- Building organizational capabilities alongside technology implementation
Most retailers already possess the data necessary for significant forecasting improvements. The challenge lies in transforming scattered information into actionable insights that drive profitable inventory decisions.
Our systematic approach combines advanced analytics with practical retail experience, delivering measurable results within 90 days while building sustainable forecasting capabilities for long-term competitive advantage.