TL;DR
- Retailers using proper attribution models recover $75K-$500K in wasted ad spend annually
- Fix broken last-click attribution to reveal which channels actually drive conversions vs. just take credit
- 85% higher sales growth for retailers leveraging unified customer data across all touchpoints
- Follow the 6-step implementation roadmap to see measurable results within 60-90 days
- Multi-touch attribution reveals Instagram/Pinterest drives 40%+ of discovery but gets zero last-click credit
Quick Answer
Retail marketing analytics systematically collects and analyzes customer behavior data, campaign performance metrics, and sales patterns across all channels to optimize marketing spend, improve attribution accuracy, predict customer lifetime value, and drive measurable revenue growth through data-driven decisions.
I watched a 40-location apparel retailer burn $200K on Instagram, Google, and email campaigns last year.
Their attribution model gave 100% credit to whichever channel the customer clicked last. Instagram drove awareness, Google nurtured consideration, email pushed them to cart, but Facebook retargeting got all the credit because it closed the deal.
So they tripled their Facebook budget and cut Instagram by 40%.
Sales dropped 18% in two months.
This isn’t a data problem. It’s an attribution problem. And I see it everywhere: retailers drowning in dashboards, obsessing over vanity metrics, and making million-dollar decisions based on fundamentally broken measurement systems.
In this guide, I’m showing you the exact retail marketing analytics framework I’ve used to help brands recover $2.3M in wasted ad spend, increase ROAS by 127%, and finally prove which marketing channels actually drive sales versus which ones just take credit.
What Is Retail Marketing Analytics?
Retail marketing analytics is the systematic process of collecting, analyzing, and interpreting customer behavior data and campaign performance metrics to make smarter marketing decisions that drive measurable revenue growth.
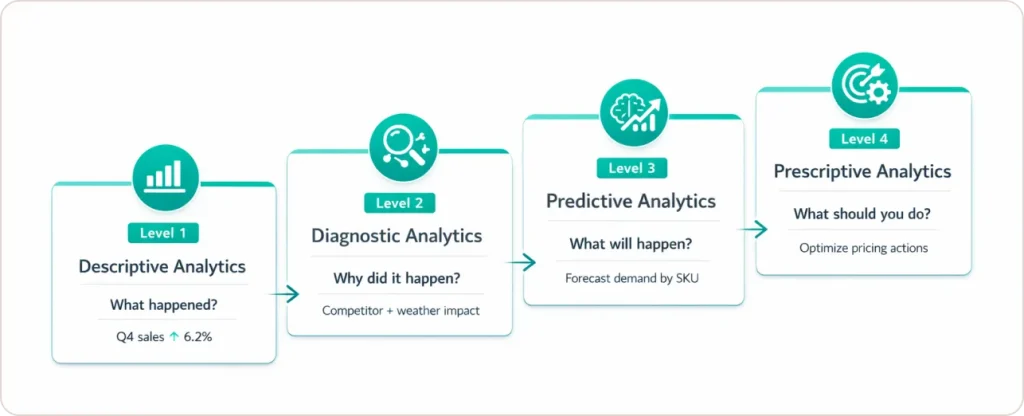
It connects customer touchpoints from first brand interaction through repeat purchases, helping you optimize marketing spend across channels. The framework includes four maturity levels:
Descriptive Analytics (What happened?) tells you Q4 sales grew 6.2%. Great. Why? No idea.
Diagnostic Analytics (Why did it happen?) uncovers that your sales dip coincided with a competitor opening nearby, plus weather that kept foot traffic down 40%.
Predictive Analytics (What will happen?) uses machine learning to forecast next quarter’s demand at SKU level, so you staff appropriately and avoid stockouts.
Prescriptive Analytics (What should you do?) recommends specific actions, like a 15% discount on inventory at three locations to prevent spoilage while maximizing margin.
Most retailers I work with are stuck between descriptive and diagnostic. They know what happened, maybe even why. But they’re making next quarter’s decisions based on gut instinct and last year’s performance.
Why Traditional Spreadsheet Tracking Fails
Your customer doesn’t experience your brand in Excel rows.
They see an Instagram ad while scrolling at lunch. Google your brand name three days later. Subscribe to your email list. Abandon cart twice. Click a Facebook retargeting ad. Then walk into your store and buy.
Traditional tracking captures fragments of this journey but can’t stitch them together. So you’re optimizing campaigns based on incomplete pictures.
Here’s what retail data insights actually reveal:
| Analytics Type | What It Reveals | Revenue Impact |
|---|---|---|
| Customer Behavioral Analytics | Who’s buying and conversion patterns | +20% AOV through cross-sell optimization |
| Channel Performance Analytics | Which touchpoints drive real conversions | Recover $50K-$180K in wasted budget allocation |
| Inventory & Demand Analytics | What to stock where, when | -40% stockouts, -30% markdown waste |
| Marketing ROI Attribution | Where your next dollar should go | +25% marketing efficiency |
The retailers winning in 2026 aren’t spending more on marketing. They’re spending smarter because they can trace every dollar back to actual customer behavior.
According to research from IHL Group, the most profitable retailers adopt advanced predictive and prescriptive analytics at rates 3x faster than competitors, leading to significantly higher growth and margins.
How to Choose the Right Attribution Model for Your Business
This is where most retailers get stuck.
Attribution answers: “Which marketing touchpoints actually drove this purchase?” Get it wrong, and you’re pouring budget into channels that look good on paper but don’t move revenue.
Here’s my decision framework:
| Attribution Model | Best For | Major Limitation | When to Use |
|---|---|---|---|
| Last-Click | Basic reporting, brand search | Ignores entire customer journey | <5K monthly conversions, simple tracking needs |
| First-Click | Brand awareness campaigns | Doesn’t credit nurture touchpoints | Primarily focused on acquisition measurement |
| Linear | Balanced journey view | Oversimplifies complex paths | Transitioning from last-click, want conservative approach |
| Time-Decay | Short sales cycles (7-14 days) | Undervalues early awareness | Average purchase cycle <2 weeks |
| Data-Driven | Complex omnichannel journeys | Requires 10K+ monthly conversions | Sufficient data volume, need precision |
My recommendation: Start with Time-Decay or Linear if you have 1K-10K monthly conversions. You’ll immediately see which channels contribute to the journey versus which just take credit at the end.
Graduate to Data-Driven attribution once you hit 10K+ monthly conversions. The algorithmic models become significantly more accurate with volume, as explained in Google’s attribution modeling guide.
The mistake I see everywhere: Retailers using last-click attribution for awareness channels like Instagram or Pinterest. These platforms never look good under last-click because they initiate discovery. They don’t close deals.
If you’re judging Instagram performance by direct conversions, you’re leaving six figures on the table.
Our marketing analytics consulting services help retailers implement the right attribution model for their business size and customer journey complexity.
The 3 Core Pillars of Marketing Analytics in Retail
When I build analytics frameworks, I focus on three interconnected pillars:
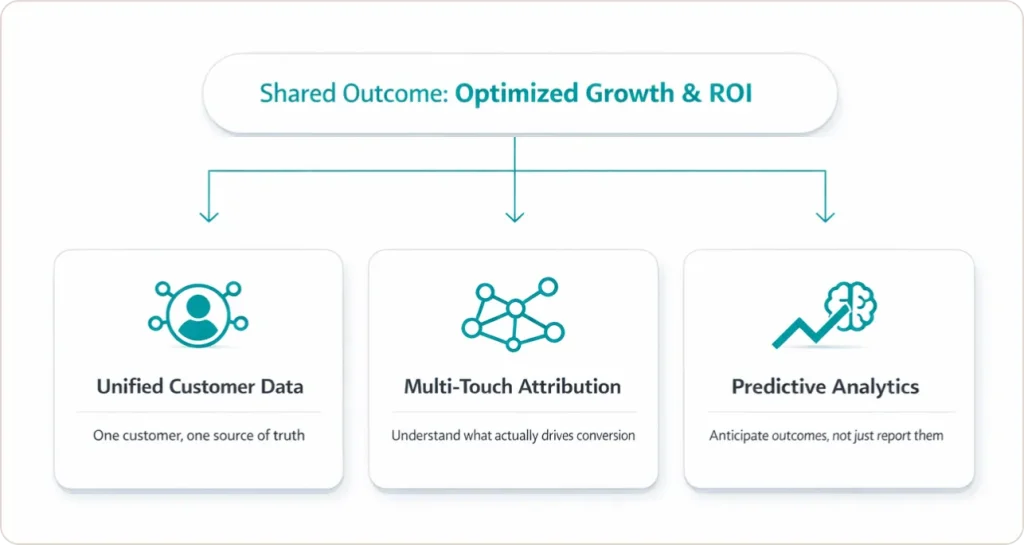
Pillar 1: Unified Customer Data
This goes beyond demographics. You need to understand:
- Purchase frequency and recency patterns
- Cross-device browsing behavior
- Channel preference signals
- Lifetime value propensity
- Churn risk indicators
The goal: Segment customers not by who they are, but by how they behave.
Technical implementation: You need a Customer Data Platform (CDP) or data warehouse that resolves customer identity across e-commerce, POS, email, social advertising, paid search, mobile app, and SMS.
I helped a regional home goods retailer implement a CDP connecting Shopify, Square POS, Klaviyo email, and Meta advertising. We discovered 40% of in-store purchasers had previously browsed online. This completely changed their attribution model and budget allocation.
Segment’s CDP guide provides excellent technical documentation on implementing unified customer profiles across multiple touchpoints.
Pillar 2: Multi-Touch Attribution
Your customer doesn’t think in channels. They see one brand.
Your analytics framework needs to consolidate performance data from every touchpoint and stitch it into unified customer journeys.
The challenge: Most retailers have 8-12 disconnected systems generating conflicting metrics. Google Analytics says one conversion number. Your email platform reports another. Your POS system shows different revenue totals.
The solution: Implement a single source of truth, typically a data warehouse that pulls data from all sources, deduplicates transactions, and creates unified reporting.
When I audit retail marketing operations, I look for:
- Can you trace customers from first Instagram impression through email engagement to in-store purchase?
- Do you know which marketing touchpoints preceded which transactions?
- Can you measure cross-device behavior (mobile browsing to desktop purchase)?
If the answer is “no” to any of these, you’re making decisions on incomplete data.
Pillar 3: Predictive Analytics
This is where retail marketing optimization transitions from reactive reporting to proactive strategy.
Customer Lifetime Value (CLV) Prediction identifies which customers will generate most revenue over time, so you can adjust acquisition spending by segment.
Churn Probability Scoring flags at-risk customers before they lapse, typically 30-45 days before expected repurchase window closes.
Next-Best-Product Recommendations uses collaborative filtering to suggest relevant products based on behavioral patterns of similar customers.
Demand Forecasting predicts SKU-level demand by location to optimize inventory investment and prevent stockouts.
One footwear retailer I worked with used CLV prediction to identify their top 8% of customers drove 34% of annual revenue. We restructured their loyalty program to over-invest in retaining this segment. The result: repeat purchase rate increased from 2.1x annually to 3.4x annually within 18 months.
ROI: $340K in incremental revenue from existing customers, zero additional acquisition cost.
Harvard Business Review’s overview of predictive analytics explains how organizations including retailers use data‑driven models to anticipate customer behavior and refined inventory decisions.
How to Implement Retail Marketing Analytics in 6 Steps
Based on helping 40+ retailers implement marketing analytics, here’s the roadmap that works:
Step 1: Define Your North Star Metric (Week 1)
Start by identifying one painful business problem better data would solve.
Good examples:
- “We’re spending $50K monthly on Meta ads but can’t prove incremental sales”
- “Our email conversion rate is 2.1% while industry average is 3.8%”
- “We stock the same products everywhere but local preferences vary wildly”
This becomes your North Star, the metric you’re trying to move.
Step 2: Audit Current Data Sources (Weeks 2-3)
Map out every data source you have. Create a matrix: rows for data sources (POS, email, ads), columns for data types (customer ID, purchase behavior, channel performance).
Mark each cell:
- Green: Have complete, accurate data
- Yellow: Have partial data or questionable quality
- Red: Missing entirely
Most retailers have 60-70% of needed data. It’s just trapped in disconnected systems.
Step 3: Implement Integration Infrastructure (Weeks 4-8)
Small retailers ($1M-$10M revenue):
- Use native integrations (Shopify + GA4 + Klaviyo)
- Budget: $5K-$15K one-time + $200-$500/month
- Timeline: 2-4 weeks
Mid-market ($10M-$100M revenue):
- Invest in CDP (Segment, RudderStack, mParticle)
- Budget: $30K-$75K implementation + $1,500-$5K/month
- Timeline: 8-12 weeks
Enterprise ($100M+ revenue):
- Build data warehouse (Snowflake, BigQuery, Redshift)
- Budget: $150K-$500K implementation + $5K-$20K/month
- Timeline: 4-6 months
Our data analytics implementation services handle the technical heavy lifting so your team can focus on insights, not infrastructure.
Step 4: Build Role-Specific Dashboards (Weeks 6-10)
Create dashboards that answer 5-7 critical questions per role:
Marketing Manager: ROAS by channel, CAC by source, email engagement, attribution reporting
Merchandising: Sales velocity by SKU, inventory turnover, stockout frequency, markdown performance
Executive: Revenue trends, customer lifetime value by cohort, marketing efficiency ratio, retention rates
Tableau’s retail analytics dashboards provide excellent starting points for building role-specific reporting.
Step 5: Run Your First Test (Weeks 8-12)
Start with one high-impact test:
Incrementality Test (Geo-Holdout): Stop ads to 10% of markets, continue in 90%. Measure sales difference to identify non-incremental spend.
Attribution Window Test: Compare 7-day vs 30-day post-click to see how channel credit changes.
Personalization A/B Test: Behavioral recommendations vs generic bestsellers.
One retailer ran geo-holdout on Google Shopping. Discovered Shopping ads were 78% incremental (good) but branded search was only 23% incremental (bad, mostly cannibalized organic clicks). They cut branded search budget by 65% ($40K annually) and reallocated to Shopping and Pinterest.
Step 6: Scale and Iterate (Ongoing)
Every quarter, measure something you couldn’t measure before:
Q1-2: Fix attribution, implement basic segmentation, build automated dashboards Q3-4: Add predictive analytics, implement behavioral workflows, expand attribution to offline Q5-6: Build sophisticated segmentation, real-time personalization, automated optimization
3 Real Client Examples with Specific Numbers
Example 1: Outdoor Recreation Retailer – 25% Stockout Reduction
Client: E-commerce retailer selling bicycles and paddleboards across Shopify and Amazon
Problem: Fragmented data across 6 platforms caused frequent stockouts and excess inventory. Departments used different metrics, delaying decisions.
Solution:
- Built Snowflake data warehouse consolidating all platforms
- Automated inventory tracking with Power BI dashboards
- Implemented demand forecasting models
Results (6 months):
- Stockouts reduced by 25%
- Online sales up 15%
- Marketing efficiency improved 20%
“SR Analytics transformed the way we view and use our data. The ROI on their solution has been incredible.” — COO, E-commerce Company
Read the complete case study →
Example 2: Awe Inspired – 50% Reporting Workload Reduction
Client: Los Angeles-based fine jewelry brand with 40% YoY growth
Problem: Rapid SKU expansion (5-10x) scattered data across Shopify, Cin7, Airtable, and Excel. Limited inventory visibility hurt demand planning.
Solution:
- Integrated platforms into Google BigQuery warehouse
- Built 12+ Looker Studio dashboards
- Connected GA4, Facebook, Shopify, Klaviyo, Zendesk
Results (4 months):
- Conversion rate up 10%
- Reporting workload cut by 50% FTE
- Inventory levels reduced through tighter management
“We’ve been able to basically decrease the workload of almost half an FTE by now having more direct access to reporting.” — Tim Eisenmann, COO, Awe Inspired
Example 3: ’47 Brand – 20 Hours Monthly Saved on Reporting
Client: Premier sports apparel brand with global e-commerce
Problem: Data spread across Shopify, Klaviyo, Google Ads, Meta Ads, and social platforms. Manual reporting consumed significant resources.
Solution:
- Centralized reporting in Looker Studio
- Unified e-commerce, email, paid ads, and social data
- Automated dashboard workflows
Results:
- 20 hours saved monthly on reporting
- Complete e-commerce funnel visibility
- Improved marketing budget allocation via ROI analysis
See more examples in our retail analytics case studies showing how data-driven decisions recover wasted spend.
What’s Coming in 2026-2027
Agentic AI and Autonomous Optimization
According to 2026 Retail Industry Global Outlook, 68% of retailers are planning to deploy agentic AI in the next 12-24 months. These AI systems autonomously optimize campaigns, adjust pricing, and personalize recommendations in real-time.
What to do now: Implement AI-powered bid management (Google Smart Bidding, Meta Advantage+), use predictive analytics for demand forecasting, deploy recommendation engines that learn from behavior.
First-Party Data as Competitive Moat
Third-party cookies are dead. iOS privacy controls block most tracking. Winners will be retailers with strong first-party data relationships.
What to do now: Build value exchange programs encouraging account creation, implement progressive profiling, use server-side tracking for privacy-compliant measurement.
Timeline: Start building first-party infrastructure now. Retailers waiting until 2027 will be 18-24 months behind.
Google’s privacy sandbox initiative outlines the future of privacy-preserving measurement that all retailers need to understand.
How Retail Data Analytics Drives Competitive Advantage
Data-driven retail operations are no longer optional. They’re essential for survival.
Retail data analytics has evolved from back-office reporting into the primary engine of competitive advantage. Organizations implementing unified measurement frameworks can:
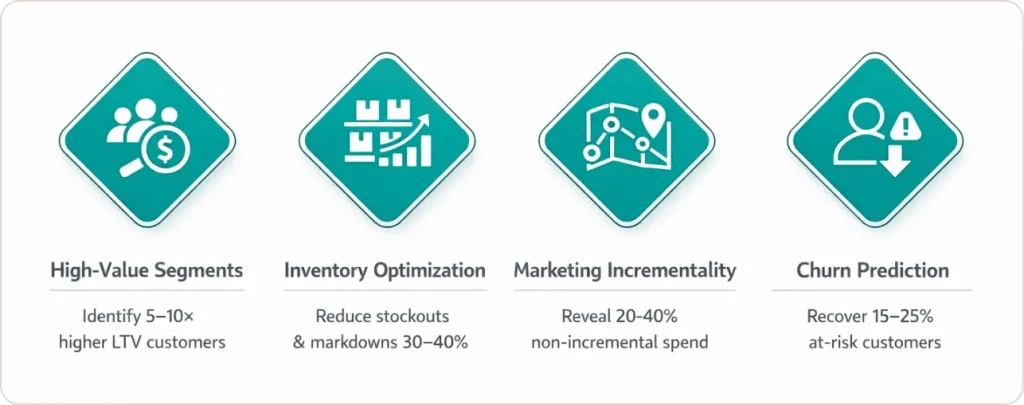
- Identify high-value customer segments worth 5-10x more in lifetime value, enabling precise acquisition budget allocation.
- Optimize inventory at hyperlocal levels based on neighborhood demographics, reducing stockouts and markdown waste by 30-40%.
- Measure true marketing incrementality through geo-based holdout tests, typically revealing 20-40% of current spend is non-incremental.
- Predict churn 30-45 days in advance and deploy targeted retention campaigns that recover 15-25% of at-risk customers.
The U.S. retail analytics market is expanding from $2.6 billion in 2024 to $11.4 billion by 2033, according to IMARC Group. This growth signals that data infrastructure is now fundamental business infrastructure, not a competitive luxury.
Retailers building sophisticated analytics capabilities in 2026 will dominate through 2030. The question isn’t whether to invest. It’s whether you’ll lead the transformation or scramble to catch up.
Conclusion: Your Next Steps
The retailers capturing 85% higher sales growth aren’t spending more on marketing. They’re making smarter decisions because they understand which customers to target, which channels drive real revenue, which products to stock where, and which segments offer highest lifetime value.
Your action plan this week:
- Choose your North Star metric. One painful problem better data would solve
- Audit your current data using the matrix I described
- Pick one quick-win test you can implement in 2-4 weeks
- Schedule time for implementation. This doesn’t happen by accident
The data frameworks you build in 2026 will determine your market position through 2030.