Key Highlights
- Calculate price elasticity across seven dimensions most retailers ignore
- Avoid the three critical errors that cost one retailer $1.2M
- Deploy pricing intelligence dashboards in weeks, not quarters
- Build analytics capabilities that scale without enterprise software dependencies
- Access proven frameworks from 50,000+ hours of retail pricing engagements
Introduction
“Most retailers lose 3-7% margin to pricing errors their data could prevent.”
Every percentage point matters in retail. McKinsey research[1] shows a single percentage increase in optimized pricing can boost profits by 8%, yet most mid-market retailers believe sophisticated pricing analytics requires enterprise software platforms costing $500K+ annually.
Here’s what the software vendors won’t tell you: 67% of pricing optimization failures have nothing to do with software. They fail because retailers lack the foundational analytics infrastructure, clean consolidated data, properly calculated elasticity models, and integrated business intelligence dashboards that turn pricing insights into executable strategy.
At SR Analytics, we’ve seen this pattern across 50+ retail engagements. A retailer invests in expensive pricing software, only to discover their transaction data has 23% error rates, their promotional history isn’t properly tagged, and their elasticity calculations have been inverted for six months, mathematical errors that make even sophisticated AI algorithms produce catastrophic recommendations.
The real competitive advantage isn’t in the software. It’s in the analytics infrastructure underneath.
Why Price Optimization Matters for Mid-Market Retailers
The Analytics Infrastructure Gap Nobody Discusses
Consumer research shows 62% of shoppers prioritize price above all other factors. In 2025’s environment of tariff volatility, margin compression, and digital-native competitors, traditional manual pricing methods leave 3-7% margin on the table. For a $100M retailer, that’s $3-7M in annual profit lost to pricing inefficiency.
Here’s the problem: 42% of organizations struggle simply knowing what price changes to make, not how to execute them. Most retailers lack foundational pricing intelligence for effective price optimization in retail:
- Clean, consolidated transaction data showing actual price-volume relationships
- Properly calculated price elasticity by product, customer segment, and channel
- Competitive intelligence integration that updates systematically
- Margin waterfall analysis revealing where profitability actually leaks
- Demand forecasting models that isolate pricing effects from seasonality
Without these capabilities, expensive software becomes a sophisticated calculator with garbage inputs. Price optimization for retail requires analytics foundations first, automation second.
The SR Analytics Pricing Intelligence Framework™
Over 50,000+ consulting hours across retail pricing engagements, we’ve developed a systematic methodology that prevents common failure modes in price optimization for retailers:
The P.R.O.F.I.T. Method
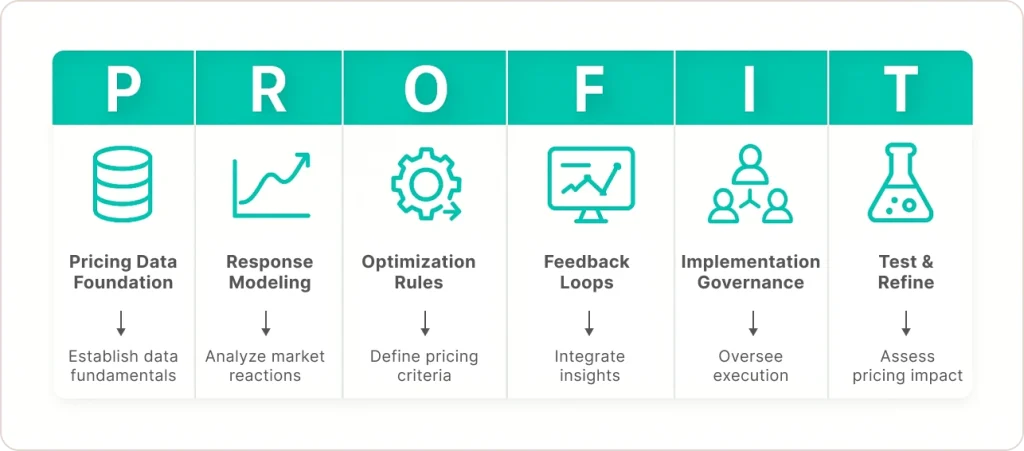
P – Pricing Data Foundation | Consolidate and validate data from multiple sources with automated quality checks
R – Response Modeling | Calculate elasticity across 7 dimensions: customer, channel, time, competition, inventory, promotion, category
O – Optimization Rules | Design custom pricing logic matching your business model and competitive positioning
F – Feedback Loops | Deploy BI dashboards with real-time monitoring and automated alerts
I – Implementation Governance | Build organizational processes ensuring teams trust and act on analytics
T – Test & Refine | Run controlled experiments isolating causal effects from correlation noise
This framework for retail price optimization addresses the critical gaps that cause most DIY initiatives to fail within their first 90 days.
When DIY Pricing Analytics Cost $1.2M (And How We Fixed It)
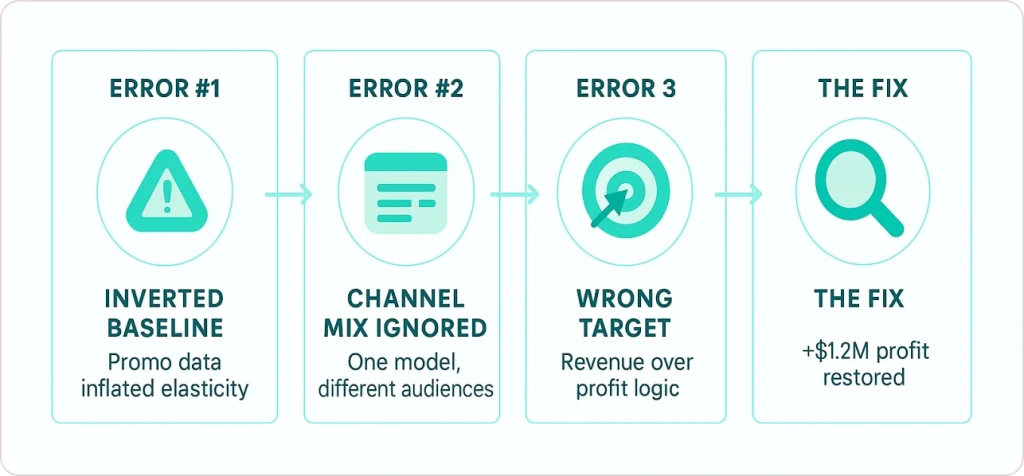
A $320M home goods retailer spent 8 months building in-house pricing analytics. Their data team successfully consolidated transaction data, calculated elasticity, built Power BI dashboards, and implemented automated pricing rules.
The problem? They’d made three critical errors:
Error #1: Inverted Promotional Baseline
They calculated elasticity using all historical transactions, including deep promotional periods. This dramatically overestimated price sensitivity, leading to chronic underpricing on core products.
Impact: 6% revenue growth, but 2.1% margin decline.
Error #2: Ignored Channel Mix Shifts
Online sales grew from 12% to 28% during their analysis period. Different customer segments, different price sensitivity, but their model treated all transactions identically.
Impact: Pricing rules optimized for in-store dynamics hurt online conversion rates.
Error #3: Wrong Optimization Target
They optimized for revenue instead of profit contribution. According to Harvard Business Review research on pricing strategy, revenue-maximizing prices aren’t margin-maximizing prices when accounting for inventory costs and customer lifetime value.
Impact: Growing sales of low-margin products while high-margin items sat underpriced.
The Rescue
Our 4-week diagnostic audit identified these errors immediately and quantified the damage: $1.2M in foregone profit over 8 months. We rebuilt their elasticity models with proper segmentation, corrected their optimization logic, and implemented test designs isolating causal effects.
Their dynamic pricing analytics now drive consistent 3-4% margin improvement quarter-over-quarter.
The CFO’s reflection: “We thought we were being smart doing it in-house. The $75K we spent with SR Analytics saved us from a $1.2M mistake and taught us what questions to ask of our data that we never thought to ask.”
Why Most DIY Pricing Analytics Fail
The 90-Day DIY Cliff
Most retailers attempting in-house pricing analytics hit a wall within 90 days. Not because their teams lack intelligence, because pricing analytics have hidden complexity that only reveals itself after you’ve committed resources.
Common Failure Modes:
Data Quality Illusions – Your transaction data looks clean until elasticity models produce nonsensical results. Return processing creates duplicate transactions. Promotional tags aren’t consistent. SKU taxonomies changed twice in 18 months. Your “clean” data has 15-30% error rates in dimensions that matter for price optimization retail implementations.
The Attribution Trap – Sales increased 8% after your price test. Was it the price? Or competitor promotions? Or the weather? Or TikTok trends? Isolating causal effects in pricing experiments requires experimental design expertise, control groups, randomization, statistical power calculations. Most teams mistake correlation for causation.
Organizational Resistance – Your merchandising VP won’t trust pricing recommendations from “the analytics team’s Excel model.” Without executive sponsorship, governance frameworks, and credibility-building pilots, analytics initiatives die in committee meetings.
Technical Debt Spiral – Your Excel model works brilliantly for 50 SKUs. At 200 SKUs, it crashes. Scaling requires replatforming, migrating to databases, building ETL pipelines, and architecting for performance.
Optimization Myopia – You optimize category A’s pricing, accidentally cannibalizing category B’s margin because you didn’t model cross-category effects.
⚠️ CRITICAL INSIGHT: The question isn’t “Can we do pricing analytics in-house?” The question is: “What’s the cost of the 12-month learning curve vs. deploying proven methodology in 12 weeks?”
Strategic Framework: What World-Class Pricing Analytics Requires
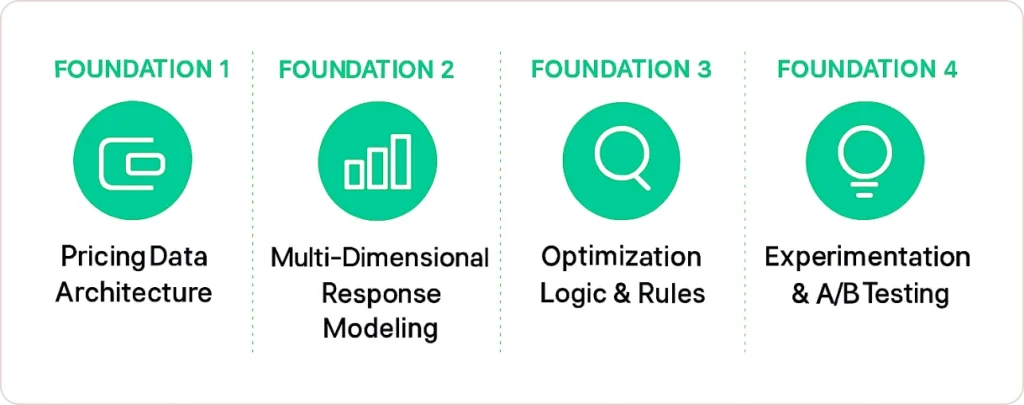
Foundation 1: Pricing Data Architecture
Transaction data consolidation sounds straightforward until you encounter reality: POS data doesn’t match ERP due to return processing timing differences. E-commerce platforms use different promotional coding than in-store systems. SKU taxonomies changed multiple times, breaking historical continuity.
Where DIY fails: Teams spend 2-3 months building “consolidated” datasets with 15-30% error rates they don’t discover until models produce absurd recommendations.
Expert implementation: SR Analytics deploys automated data quality checks, reconciliation logic across systems, and validation rules that flag anomalies before they corrupt analysis. This foundation is critical for retail AI maximize margin digital tagging price optimization implementations.
Foundation 2: Multi-Dimensional Price Response Modeling
Price elasticity needs calculation across at least 7 dimensions, not single averages that mask critical variation:
- Promotional interactions: Elasticity during promotions is 2-4x higher than base elasticity
- Customer segment variation: New customers show -1.8 elasticity; loyal customers show -0.4 elasticity
- Competitive effects: Your elasticity depends on competitor pricing context
- Inventory-price interactions: Products with 90+ days inventory have different optimal pricing
- Cross-category effects: Pricing anchor products affects traffic to complementary categories
“📊 DATA POINT: In one engagement, the retailer’s DIY elasticity model showed -1.2 average. Our segmented analysis revealed it ranged from -0.3 (loyal customers) to -2.4 (bargain hunters). Pricing differently to each segment increased margin 4.7% without losing volume.”
Foundation 3: Optimization Logic and Rule Design
Optimization isn’t just math, it’s strategic judgment encoded into executable logic. Rules must balance multiple objectives: margin vs. market share, competitive response thresholds, brand positioning constraints, organizational approval workflows.
Where DIY fails: Teams build mathematically optimal rules that organizational reality rejects or that create execution chaos.
Expert implementation: We facilitate workshops with executive teams to encode strategic judgment into optimization logic, then design governance frameworks ensuring systematic pricing changes without organizational chaos.
Foundation 4: Business Intelligence Dashboards
Dynamic pricing analytics requires forward-looking decision dashboards, not backward-looking reports:
- Which products should we reprice this week based on inventory, competitive moves, and demand trends?
- What are our top 20 pricing opportunities ranked by expected profit impact?
- Which recent pricing changes underperformed expectations and why?
- Where are competitors systematically under-pricing us by >15%?
SR Analytics designs dashboards through user research with merchandising teams, building interfaces that integrate naturally into existing workflows with better data. Modern BI platforms like Power BI enable real-time pricing intelligence that was previously only available to enterprise retailers.
Real-World Results: Analytics-First Success
Regional Apparel Retailer ($180M Revenue)
A Southeast outdoor apparel retailer believed they were losing to Amazon on price. Our 2-week diagnostic revealed the opposite: they were systematically under-pricing differentiated products by 12-18%.
Their internal team had calculated elasticity including promotional periods, artificially inflating price sensitivity by 60-80%. They’d been leaving a massive margin on core hiking boot categories where customers were actually brand-loyal and price-insensitive.
Our 90-day implementation:
- Rebuilt elasticity models with proper segmentation
- Identified $2.1M immediate margin recovery opportunity
- Deployed Power BI dashboards integrating inventory, competitive intelligence, and elasticity
- Ran controlled pricing tests validating model predictions
Results after 6 months:
- 4.7% gross margin improvement
- $847K incremental annual profit
- 8.3x ROI on consulting engagement
- Zero volume loss on repriced items
The CFO: “We were about to spend $600K on pricing software to ‘fix’ a problem we’d misdiagnosed. SR Analytics showed us the problem was our analysis, not our tools.”
This case demonstrates how effective price optimization in retail starts with analytics capabilities, not software purchases.
The Enterprise Software vs. Analytics-First Comparison
| Approach | Enterprise Software | SR Analytics Method | Pure DIY |
|---|---|---|---|
| Time to Value | 12-18 months | 6-12 weeks | 6-12 months (if successful) |
| Investment | $500K-$1M | $75K-$150K | $15K-$30K (+ $200K failures) |
| Customization | Limited templates | Fully custom | Depends on capabilities |
| Capability | Vendor-dependent | Builds permanent expertise | High technical debt risk |
| Failure Rate | 40% fail ROI | <15% with scoping | 70%+ abandon in 90 days |
| Best For | 5,000+ SKUs, mature teams | 100-2,000 SKUs, growth focus | Low-stakes experiments |
The strategic insight: Build analytics infrastructure first. Evaluate software later as a scaling solution, or discover your custom system scales indefinitely at 10% of the cost.
How SR Analytics Accelerates Your Pricing Journey
What Sets Our Approach Apart
We Audit Before We Build – 60% of engagements start diagnosing existing efforts, DIY projects, underperforming software, legacy processes. We identify what works, what fails, and why.
We Transfer Capability, Not Create Dependency – We embed with your team and transfer knowledge systematically. When we exit, you understand not just how to run models, but why they work and how to evolve them.
We’ve Seen Every Failure Mode – 50,000+ hours across 50+ retail pricing engagements means we don’t learn on your dime, we deploy proven solutions, then customize for your context.
We Balance Rigor with Pragmatism – Models sophisticated enough to be accurate, simple enough to be explainable. Merchandising VPs trust recommendations they understand.
Typical Engagement Models
Diagnostic Audit (2-4 weeks) – $15K-$30K
Assess data readiness, audit existing models, identify quick wins, roadmap implementation
Rapid MVP (6-10 weeks) – $50K-$75K
Build foundational pricing analytics on top 20% revenue-generating SKUs, prove value before scaling
Comprehensive System (3-6 months) – $100K-$200K
Full P.R.O.F.I.T. methodology implementation with change management and capability transfer
Ongoing Partnership (retainer) – $5K-$15K/month
Continuous optimization, model refinement, strategic guidance without full-time hires
The Bottom Line
The retailers winning on price optimization retail initiatives in 2025 aren’t those with the most sophisticated software, they’re those who built analytics infrastructure first. Clean data, proper elasticity models, integrated business intelligence, and organizational capabilities that compound over time.
Enterprise software might eventually make sense as an automation layer. Or it might not, many retailers discover their custom analytics systems scale indefinitely at a fraction of the cost.
The question isn’t whether you can build pricing analytics. The question is: What’s the cost of the 12-18 month learning curve vs. deploying proven methodology in 12 weeks?
For most mid-market retailers facing margin pressure and competitive threats, expert guidance delivers 5-10x ROI in year one while building permanent internal capabilities.
The playing field is leveling. Retailers who build proper analytics infrastructure now, whether through internal development, consulting partnerships, or hybrid approaches, position themselves to capture margin their competitors leave on the table. The data already exists in your systems. The question is whether you’ll turn it into competitive advantage or watch others do it first.
Learn more about implementing retail analytics solutions that turn pricing data into sustainable profit growth.