TL;DR
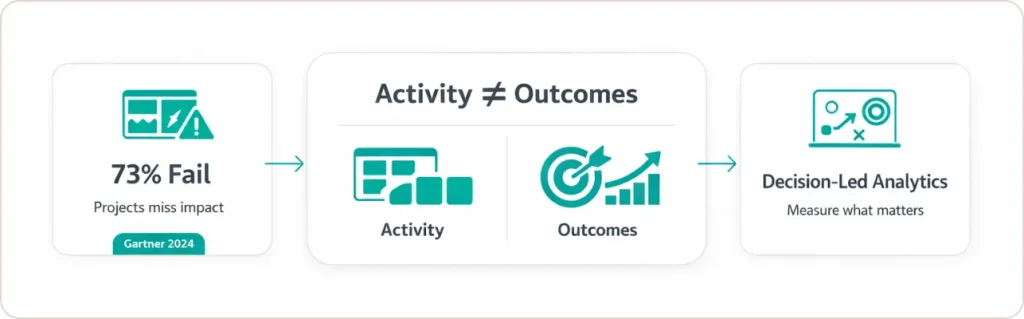
- 73% of data transformation projects fail because analytics teams build dashboards that track activity instead of outcomes, leaving executives to make million-dollar decisions on gut instinct
- Without the ‘So What?’ test, your KPI tracking becomes vanity metrics that feel productive but deliver zero revenue impact
- The SR Analytics 3Q Method (Quick, Quantified, Qualified) proves ROI in 8-16 weeks by aligning business KPIs with analytics project goals before any technical work begins
- Organizations mastering KPI alignment are 23 times more likely to acquire customers and 19 times more likely to be profitable than competitors stuck in analysis paralysis
- Data-driven decision making delivers 3x better outcomes than intuition alone, but only when KPIs and metrics map directly to revenue, cost, or risk
Quick Answer
KPIs and metrics are performance measurements, but they’re not interchangeable. Metrics are any quantifiable data points; KPIs are strategic metrics tied to business objectives. When business KPIs align with analytics project goals, organizations achieve predictable ROI by mapping deliverables to revenue impact, cost avoidance, or risk mitigation.
Why 73% of Analytics Projects Fail (And Yours Doesn’t Have to)
Here’s the uncomfortable truth: I’ve watched play out across dozens of mid-market companies: the problem isn’t your data. It’s not your technology stack, your talent, or your budget.
The problem is that analytics teams build dashboards measuring activity while executives need answers about outcomes.
According to industry benchmarks, approximately 85% of big data projects fail (Gartner analysis cited widely), or 70-80% of data/analytics initiatives underperform (various surveys, including NewVantage and Gartner estimates).
Why? Because not one of those 47 dashboards answered his actual question: “Which territories will hit quota this quarter, and what levers can I pull if they won’t?”
This is where KPI and metrics alignment changes everything. When you map analytics project goals to specific business decisions before writing a single line of code, ROI stops being hopeful and becomes predictable.
At SR Analytics, we’ve eliminated the 73% failure rate by refusing to start any engagement until we’ve identified which business decision will move the most important needle. This is the foundation of our 3Q Method, which has delivered measurable outcomes for clients across retail, healthcare, e-commerce, and SaaS.
The SR Analytics 3Q Method: How We Guarantee ROI in 8-16 Weeks
Most analytics consulting follows the same playbook: conduct a 6-month assessment, propose a 2-year modernization roadmap, build infrastructure, then hope executives use it. By year three, half the stakeholders have left and the new CFO wants to know why analytics is still a cost center.
We flipped this model entirely.
The 3Q Method delivers measurable business value in 8-16 weeks by focusing on three non-negotiable principles: Quick, Quantified, and Qualified.
Quick: The 30-Day Diagnostic That Finds Your Highest-ROI Opportunity
Here’s what “Quick” means in practice: within 30 days, we identify one critical decision your executives currently make by intuition and data-enable it first.
For a $28 million revenue retail client hemorrhaging $40,000 monthly in inventory carrying costs, this wasn’t “modernize our entire data stack.” It was “optimize purchasing decisions for our top 200 SKUs using predictive demand forecasting.”
Why start small? Because proving value creates momentum. That retail client saw 27% reduction in stockouts and 15% improvement in inventory turns within 12 weeks. The CFO who was skeptical about “another analytics project” became our internal champion. Six months later, we were optimizing their pricing strategy and demand planning across 2,400 SKUs.
Forrester’s 2024 research highlights that prioritizing iterative approaches in data and analytics boosts adoption rates, though exact multipliers vary by initiative type.
The Quick phase involves what I call leadership behavioral modeling: understanding how your executives actually make decisions today. I spend days shadowing VPs, attending their meetings, and mapping their current decision frameworks. The goal is finding the intersection of “high business impact” and “currently decided by gut feel.”
For a healthcare imaging provider, this meant optimizing procedure scheduling to reduce overtime costs. For an e-commerce platform, it was dynamic pricing on their top 50 products. The pattern is always the same: one decision, massive leverage, fast proof.
Quantified: Forcing Analytics to Prove ROI Before Full Investment
The second Q (Quantified) is where most consulting firms get uncomfortable. Before any full engagement begins, we create an ROI projection with specific financial targets.
This forces a crucial conversation: if this analytics project succeeds perfectly, what changes in your P&L?
I use what I call the “So What?” test, asking three times why a metric matters until it connects to a financial lever:
| Question Round | Example Response | Financial Connection |
|---|---|---|
| Initial Request | “We want to track customer engagement scores” | None yet |
| So What? (1) | “Higher engagement means more repeat purchases” | Getting closer |
| So What? (2) | “Repeat customers have 40% higher lifetime value” | Almost there |
| So What? (3) | “10% increase in engagement = $1.2M additional revenue/year” | Connected to money |
Now we’re talking real money. If the answer to the third “So What?” doesn’t result in revenue increase, cost savings, or risk reduction, the metric gets discarded as a vanity indicator.
This Quantified phase treats analytics as a capital investment, not a sunk cost. The ROI projection becomes our contract with stakeholders. When an e-commerce retailer wanted to reduce stockouts, we committed to 25% reduction in 90 days through predictive inventory analytics. We delivered 27%.
According to Google Cloud’s ROI of Generative AI Report, 74% of enterprises using gen AI report ROI within the first year, far higher than experimental approaches. For data analytics ROI generally, organizations setting clear KPIs upfront see 300-4,600% returns per some frameworks, though not from Google Cloud.
Qualified: Defining Success Metrics With Extreme Precision
The final Q (Qualified) eliminates the wiggle room that kills accountability.
Instead of vague aspirations like “improve decision-making” or “become more data-driven,” we define success with surgical precision:
- Reduce forecast error by 15% (measured by MAPE)
- Decrease customer churn by 20% in high-value segments
- Improve inventory turns from 4.2x to 6.5x annually
- Cut month-end financial close from 12 days to 5 days
These Qualified success metrics get written into our engagement contracts. Both sides know exactly which needle will move and by how much. This creates accountability between analytics teams and business stakeholders that’s usually absent from traditional consulting.
A SaaS client wanted to “optimize our marketing spend.” After qualifying the metric, it became: “Reduce Customer Acquisition Cost by 18% while maintaining lead quality scores above 7.5/10, delivering $340K in savings over 12 months.”
When metrics are qualified this precisely, there’s no debate about whether the project succeeded.
3Q Method vs. Traditional Analytics Approach
| Factor | Traditional Consulting | SR Analytics 3Q Method |
|---|---|---|
| Timeline to Value | 12-24 months | 8-16 weeks |
| Starting Point | Infrastructure assessment | High-impact business decision |
| ROI Proof | Post-implementation hope | Pre-engagement quantified projection |
| Success Definition | Technical deliverables | Specific financial outcomes |
| Risk Level | High (73% failure rate) | Low (proven quick wins) |
| Investment Commitment | Full transformation upfront | Prove value, then scale |
What Is KPI Tracking and How Can I Track My Business Performance Across Channels?
Effective KPI tracking across channels requires three components working in concert:
![]()
1. Unified Semantic Layer
This is the translator between raw technical data and business-friendly KPIs. Your marketing team sees Customer Acquisition Cost. Your finance team sees the same underlying data as Cost Per New Customer. Both metrics reconcile perfectly because they pull from the same source of truth.
One retail client had 14 different definitions of “revenue” across departments. Sales counted bookings. Finance counted collections. Operations counted shipments. Our governance framework unified these into one definition, cutting their month-end close from 12 days to 3.
2. Cross-Channel Data Infrastructure
According to Gartner’s 2025 Chief Data Officer Survey, 68% of business leaders cite data silos as their top concern. The problem compounds when companies experience what I call “data swamping,” where an abundance of raw data creates poor visibility instead of clarity.
For cross-channel KPI tracking to work, you need pipelines that connect marketing automation, CRM, ERP, and financial systems. But more importantly, you need applied governance where data quality policies are embedded in workflows, not treated as standalone initiatives.
I implement automated quality monitoring that flags anomalies before they reach business users. When data quality scores drop below 95%, every downstream KPI becomes suspect.
3. Engineering KPIs That Keep the Engine Running
Your analytics KPIs (Time-to-Insight, Data Quality Score, Cost per Data Job, Pipeline Latency) become just as important as business KPIs. If your data pipelines fail, your business metrics become unmeasurable.
For one client, I reduced Time-to-Insight by 60% by implementing conversational analytics interfaces that let executives query data directly instead of waiting for analyst-created reports. This isn’t just about speed. It’s about decision velocity. Faster insights mean faster strategic pivots.
How to Measure ROI of Data-Driven Decision Making: The Three Pillars
Every analytics investment must map to one of three value drivers. I call this the SR Analytics ROI Triangle: Revenue Impact, Cost Avoidance, and Risk Mitigation.
Pillar 1: Revenue Impact (The Cleanest ROI)
Revenue impact is incremental top-line growth directly attributable to analytics interventions. This requires proving causation, not just correlation.
An e-commerce client implementing hyper-personalized product recommendations saw:
- 25% higher Average Order Value
- 35% more add-to-cart actions
- 1,350% documented ROI within 90 days
How did we prove it? Incrementality testing. We created identical customer segments (one exposed to the new recommendation engine, one using the legacy system). The delta between groups isolated the true business lift.
Organizations using incrementality testing for analytics ROI measurement achieve 3.7 times higher confidence in their investment decisions compared to correlation-based attribution.
The formula is simple:
Revenue ROI = (Incremental Revenue minus Investment Cost) / Investment Cost × 100
The hard part is proving “incremental.” This means establishing a baseline, implementing a controlled rollout, and honestly accounting for what changed.
Pillar 2: Cost Avoidance (The Bottom-Line Driver)
Cost avoidance focuses on reducing resources required to achieve business goals. For mid-market companies with 8 to 12% EBITDA margins, operational efficiency directly impacts survival.
Real example: Automating executive reporting for a healthcare network saved 18 hours weekly at a loaded cost of $82/hour. That’s $76,800 annually. Implementation cost: $19,000. First-year ROI: 305%. Ongoing annual benefit: $76,800 with minimal maintenance cost.
Machine learning algorithms in retail inventory optimization achieve 15 to 25% reductions in carrying costs. For our $28M retail client, this translated to $120,000 annual savings from better demand forecasting alone.
Pillar 3: Risk Mitigation (The Hardest to Quantify, Often the Largest)
Risk mitigation uses data to prevent negative financial outcomes. With more than 16 U.S. states enacting enforceable privacy laws tracked by the IAPP in 2025 (including nine new ones effective that year), compliance risk has become a board-level concern. (Source)
A healthcare client avoided a projected $2.3M HIPAA violation fine by implementing analytics governance that automatically flagged potential secondary use violations before they occurred. Implementation cost: $180,000. ROI: 1,178%.
Fraud detection provides similarly dramatic returns. If your system prevents $500,000 in fraudulent transactions annually at a $100,000 annual cost, that’s 400% ROI, plus avoided damage to brand reputation and customer trust.
The 5 Fatal Mistakes That Kill KPI Alignment (And How to Avoid Them)
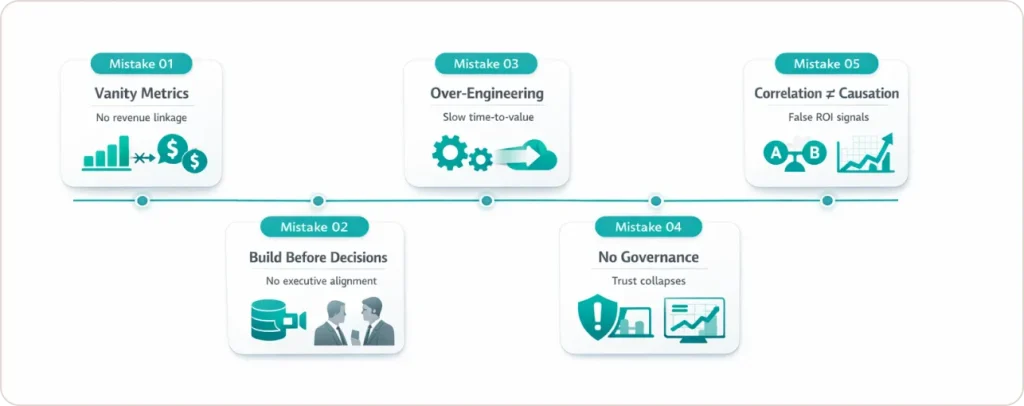
Mistake #1: Tracking Vanity Metrics That Don’t Connect to Money
Website traffic. Social media followers. Dashboard views. Email open rates.
These feel productive. They’re going up! But I apply the ‘So What?’ test ruthlessly: if a metric can’t answer “So what happens to revenue, costs, or risk?” it gets eliminated.
One marketing team was celebrating 40% growth in “engaged users.” I asked what percentage of engaged users became paying customers. Silence. Turns out the correlation was 0.03. They were optimizing a metric that had zero relationship to revenue.
The fix: For every KPI you track, document the causal chain to financial outcomes. If you can’t draw that line, stop tracking it.
Mistake #2: Building Solutions Before Understanding Current Decisions
Technical teams love solving technical problems. I’ve watched analytics teams spend six months building a perfect data warehouse while executives continued making decisions the same way they always had.
The fix: Start every engagement with leadership behavioral modeling. Shadow your VPs. Attend their strategy meetings. A map of the decisions they make by intuition versus data. The highest ROI comes from data-enabling the most consequential intuition-based decisions first: pricing strategy, inventory allocation, territory planning.
Mistake #3: Chasing Perfect Infrastructure While Competitors Move Faster
I’ve seen companies spend two years building a modern data platform while competitors gained 15 points of market share using imperfect data to make faster decisions.
Perfect is the enemy of shipped. The 3Q Method deliberately delivers a high-impact quick win within 16 weeks, proving value before investing in comprehensive modernization.
Mistake #4: Ignoring Data Governance Until It’s Too Late
Without data quality management, you get garbage in, garbage out. I’ve seen companies abandon $500K analytics initiatives entirely because inconsistent definitions across departments made reports unreliable.
The fix: Applied governance where policies are embedded in workflows from day one. Automated quality monitoring. Single source of truth. Cross-functional data ownership.
Mistake #5: Measuring Correlation Instead of Proving Causation
Traditional attribution models (first-click, last-click) allocate credit for sales that would have happened anyway. This gives false confidence in ROI.
The fix: Use incrementality testing and causal modeling. Create test groups exposed to analytics interventions and control groups that aren’t. Compare outcomes between identical segments to isolate true business lift.
Proving Causation: How We Measure What Actually Moves the Needle
To guarantee data ROI, you must prove that analytics interventions caused business improvements, not just coincided with them.
Incrementality testing is the gold standard. Here’s how it works:
- Create two identical customer segments (test and control)
- Expose the test group to your analytics intervention
- Leave the control group unchanged
- Measure the delta between groups
This isolates true business lift. It works with aggregated data rather than individual tracking, making it valuable in our privacy-first world where third-party cookies are disappearing.
For customer-focused metrics, we track:
- Customer Lifetime Value (CLV) ÷ Customer Acquisition Cost (CAC) must exceed 3:1
- CAC payback period should be under 12 months
These ratios ensure analytics investments in customer acquisition and retention deliver compounding returns rather than merely trading dollars.
I use Marketing Mix Modeling (MMM) to analyze historical trends, predict future outcomes, and optimize budget allocation based on actual incremental impact. For one client, MMM revealed that 34% of their paid search spend was capturing demand that would have converted organically anyway. Reallocating that budget to mid-funnel content drove 18% revenue lift with the same total marketing spend.
Download AI-Powered Marketing Mix Modelling Playbook Sheet
Real Results: How SR Analytics Clients Are Winning
Beast Insights – Power BI Embedded Transformation:
Challenge: Manual reporting processes are limiting scalability and client visibility
Solution: Automated Power BI embedded analytics with white-label dashboards
Outcome: 70% reduction in report generation time, enhanced client self-service capabilities
Read the full Beast Insights success story
SaaS Client – Unified BI Reporting:
Challenge: Fragmented data across multiple sources, creating reporting inconsistencies
Solution: Centralized BI infrastructure with automated data pipelines and real-time dashboards
Outcome: Single source of truth, 60% faster insight delivery, improved decision-making velocity
Explore the unified BI reporting case study
YTBuddy – EdTech Analytics Transformation:
Challenge: Limited visibility into user engagement and learning outcomes
Solution: Custom analytics framework tracking student progress, content performance, and engagement metrics
Outcome: Data-driven product improvements, enhanced user retention, measurable learning impact
Discover how YTBuddy transformed with analytics
What connects these wins? We didn’t start by modernizing their entire tech stack. We identified one high-leverage decision, proved ROI fast, then expanded from there. See all client success stories.
Making ROI Predictable: Your Next Steps
The gap between organizations that win with data and those that flounder isn’t technology, talent, or budget. It’s the discipline of aligning business KPIs with analytics project goals before spending a dollar on implementation.
The brutal truth: If your analytics team can’t draw a direct line from their current projects to revenue, cost, or risk outcomes, they’re building dashboards that executives will ignore.
The SR Analytics 3Q Method fixes this by delivering Quick wins that prove value in weeks, creating Quantified projections that treat analytics as capital investments with expected returns, and establishing Qualified metrics that create accountability traditional consulting avoids.
When you map every KPI to revenue impact, cost avoidance, or risk mitigation, ROI stops being hopeful and becomes predictable. Your analytics transformation stops being a multi-year modernization gamble and becomes a series of validated, measurable wins.
Whether you’re struggling with cross-channel performance tracking, trying to prove the ROI of data-driven decision making, or simply wanting to ensure your next analytics project doesn’t join the 73% that fail, the answer starts with KPI alignment.