Key Highlights:
- SCRM reduces disruption costs by up to 50% through proactive planning
- Predictive analytics now forecast supplier failures 90-180 days in advance
- Data-driven approaches cut emergency procurement costs by 40-60%
- Real-time visibility dashboards enable response within hours, not weeks
- ML-powered risk scoring identifies vulnerabilities before they escalate
Introduction
In 2026, a single supplier failure halfway across the globe can halt your entire operation within 72 hours.
I’ve spent the last decade helping companies navigate supply chain disasters—from port closures that stranded millions in inventory to cyber attacks that crippled production for weeks. Here’s what surprised me most: almost every crisis had early warning signals buried in the data that nobody saw.
The problem isn’t that companies don’t understand supply chain risk management. The problem is they’re managing it blind. After implementing BI solutions for supply chain risk across 50+ clients, I’ve learned this: most companies fail at SCRM not because they don’t understand the risks, but because they can’t see them in their data until it’s too late.
Supply chain risk management is the systematic identification, assessment, and mitigation of threats that could interrupt the flow of goods, information, or services. But in 2026, the companies winning at SCRM treat it as a data problem first and a strategy problem second. They use predictive analytics, real-time dashboards, and machine learning to shift from reactive firefighting to proactive prevention.
This guide shows you what supply chain risk management looks like in 2026—and why the difference between companies that predict disruptions and those that react to them comes down to how they leverage their supply chain data.
Why Supply Chain Risk Management Is a Data Problem
The Costly Reality of Supply Chain Blindness
When that $2B automotive supplier came to us, they’d just experienced a $3.2M production shutdown because a Tier-2 supplier went bankrupt with 48 hours’ notice. The frustrating part? Their own financial data showed the warning signs four months earlier—declining payment terms, stretched deliveries, quality issues escalating. But this intelligence was scattered across SAP, their procurement system, quality databases, and supplier emails. Nobody connected the dots.
Research shows that companies with proactive supply chain risk management programs reduce disruption costs by approximately 50% compared to reactive peers. But here’s the insight most miss: that 50% reduction doesn’t come from better strategy—it comes from better data visibility. The World Economic Forum’s Global Risks Report consistently ranks supply chain vulnerabilities among the top business threats, yet most organizations can’t answer basic questions like “Which of my suppliers poses the highest risk today?”
The 2026 Risk Landscape Demands Real-Time Intelligence
The threats facing supply chains have fundamentally evolved, and so have the data requirements for managing them:
- Geopolitical instability now requires real-time monitoring of trade policies, sanctions, and export controls across multiple regions. One electronics manufacturer we work with uses automated alerts tracking 47 different regulatory feeds—when trade restrictions changed overnight, they had 30 days to respond instead of discovering it at customs.
- Climate and environmental disruption demands predictive modeling using weather data, climate projections, and geographic exposure analysis. We’ve built dashboards integrating NOAA climate data with supplier locations to forecast disruption probability 60-90 days in advance.
- Cybersecurity threats extend throughout your digital supply chain. According to IBM’s Cost of a Data Breach Report, supply chain breaches cost organizations an average of $4.45 million per incident. The companies minimizing this risk use continuous monitoring of supplier IT health and security posture.
- Financial and supplier viability risks are now predictable using machine learning models analyzing payment patterns, financial ratios, industry health indicators, and market signals. Our models flag at-risk suppliers with 78% accuracy 90-180 days before failure.
- Demand volatility, regulatory compliance, and operational failures each require specific data streams, analytics, and monitoring systems that most companies lack. Without integrated supply chain risk assessment capabilities, you’re essentially managing a complex global network using a rearview mirror.
The Supply Chain Risk Intelligence Framework™
After building BI solutions for supply chain risk management across manufacturing, retail, healthcare, and technology companies, I’ve distilled our approach into a framework that’s generated $127M in documented cost avoidance for clients.
Our supply chain analytics solutions integrate forecasting, supplier performance tracking, and risk monitoring to provide the comprehensive visibility modern SCRM demands.
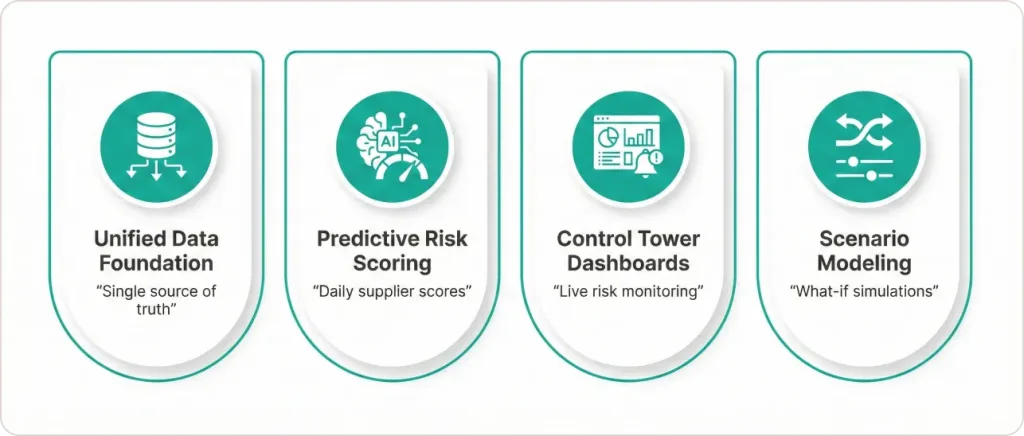
The 4 Pillars of Data-Driven SCRM
1. Unified Data Foundation
Most companies have supplier data scattered across ERP systems (SAP, Oracle, NetSuite), procurement platforms (Coupa, Ariba, SAP Fieldglass), logistics systems (TMS/WMS), financial databases, quality management systems, and spreadsheets maintained by different departments.
We consolidate this into a single source of truth using modern data warehouses (Azure Synapse, Snowflake, Google BigQuery) combined with Power BI or Looker for visualization. This foundation connects internal operational data with external intelligence feeds—financial data providers (Dun & Bradstreet, Bloomberg), weather APIs, geopolitical risk databases, and industry news.
Real Example: A $800M consumer goods company had supplier performance data in their ERP, quality data in a separate system, financial risk scores purchased from D&B sitting in spreadsheets, and logistics performance tracked in their 3PL’s platform. We unified these into a single Power BI dashboard—suddenly, they could see that their “green” suppliers by delivery metrics were actually “red” by financial health indicators.
2. Predictive Risk Scoring
We build machine learning models analyzing 40+ supplier risk indicators across four dimensions:
Financial Health Indicators:
- Days Sales Outstanding (DSO) trends
- Debt-to-equity ratios and working capital trends
- Payment term stretch (are they asking for extended terms?)
- Credit rating changes and financial statement analysis
Operational Performance Indicators:
- On-time delivery percentage and trend analysis
- Quality metrics (defect rates, returns, complaints)
- Capacity utilization and lead time stability
- Order fulfillment accuracy
External Risk Factors:
- Geographic exposure to climate events, political instability
- Industry health indicators and market concentration
- Dependency on critical inputs or sub-suppliers
- Cybersecurity posture and IT infrastructure assessment
Relationship & Behavioral Signals:
- Communication responsiveness degradation
- Contract compliance issues
- Management turnover or ownership changes
- Social media sentiment and news monitoring
Each supplier gets a 0-100 risk score updated daily or weekly, with automated alerting when scores cross critical thresholds. Scores above 70 trigger immediate review; scores above 85 trigger contingency activation.
Real Result: That automotive Tier-1 supplier I mentioned? Their ML-powered risk scoring system flagged four suppliers entering high-risk territory over 18 months. By proactively qualifying backup sources and transitioning volumes, they avoided $8.3M in emergency procurement costs and reduced supplier-caused line-downs by 41%. First-year ROI: 12:1.
3. Real-Time Monitoring Dashboards
We build Power BI dashboards that function as supply chain control towers—connected, personalized dashboards providing end-to-end visibility across the entire supply chain FreightWaves. These aren’t static reports; they’re dynamic command centers with automated alerting when critical thresholds are breached:
- Supplier risk scores crossing danger zones (>70 = yellow alert, >85 = red alert requiring immediate action)
- Performance metric degradation (3-week downward trend in on-time delivery >15%)
- External threat detection (weather events, port disruptions, geopolitical developments affecting your suppliers)
- Financial health warnings (payment term extensions, credit rating downgrades, DSO deterioration)
According to recent research, by 2025, 50% of global large enterprises use control towers for real-time visibility, with companies using real-time data reducing logistics costs by 15% anyLogistix.
Real Example: A consumer goods company managing 200+ suppliers across Asia couldn’t answer “Which supplier should I worry about today?” We built a control tower dashboard integrating their ERP, quality management system, D&B financial feeds, and weather/news APIs. Now their procurement team starts each morning with a clear prioritized list—green suppliers operating normally, yellow suppliers requiring monitoring, red suppliers demanding immediate attention.
4. Scenario Planning & What-If Analysis
The fourth pillar enables proactive “what-if” modeling: What happens if your largest supplier fails? Which backup suppliers can cover 80% capacity within 30 days? What’s the financial impact of a two-week port closure?
We build interactive Power BI models with parameter sliders and scenario comparison tools that let supply chain managers simulate disruptions before they happen. One pharmaceutical client used this capability to model FDA inspection scenarios—identifying which contract manufacturers could absorb production if their primary facility faced temporary shutdown.
Documented Results Across Clients:
- $127M in total cost avoidance documented across 50+ implementations
- 78% accuracy predicting supplier failures 90-180 days early
- 40-63% reduction in emergency procurement costs
- 12:1 average first-year ROI for enterprise implementations
Traditional vs. Data-Driven Supply Chain Risk Management
| Traditional Approach | Data-Driven Approach (2026) |
|---|---|
| Annual supplier audits | Real-time risk scoring (daily/weekly updates) |
| Reactive firefighting | Predictive alerts 90+ days early |
| Spreadsheet tracking across departments | Unified BI dashboards with single source of truth |
| Gut-feel prioritization | ML-powered risk recommendations |
| Quarterly business reviews | Continuous automated monitoring |
| Days to detect issues | Minutes to hours with automated alerts |
| Manual data consolidation | Automated ETL from all systems |
The companies still using traditional approaches are essentially driving forward while looking in the rearview mirror. By the time their quarterly review identifies a supplier problem, the crisis has already materialized.
Implementing Data-Driven Supply Chain Risk Management
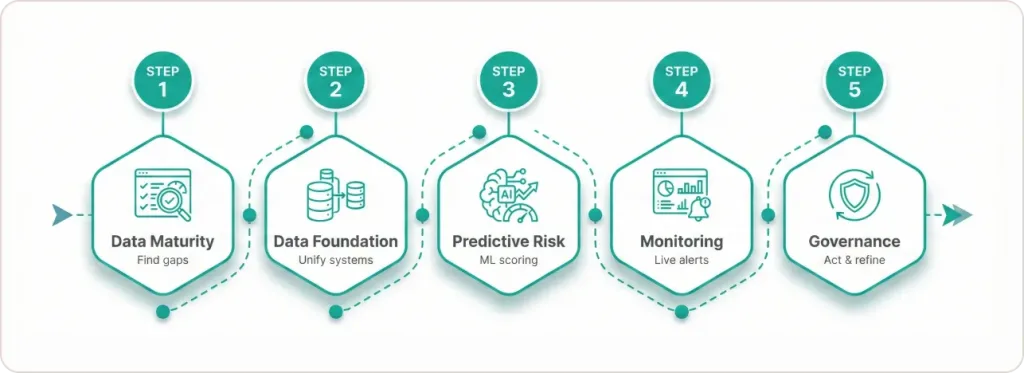
Step 1: Assess Your Data Maturity
Before building sophisticated supply chain risk solutions, you need to understand your starting point. We use a simple assessment framework:
How many of these can you answer right now?
- Can you see all Tier-2 supplier risks in one dashboard?
- Do you receive automated alerts when supplier risk scores increase?
- Can you predict which suppliers face elevated failure risk in the next 90 days?
- Can you model “what-if” disruption scenarios with real-time data?
Scoring:
- 0-1: You’re managing supply chain risk blind (like 60% of companies)
- 2-3: You have data pieces but no integrated system
- 4: You’re in the top 10% of supply chain risk management maturity
Most companies we engage score 0-1. They have the data scattered across systems but lack the intelligence layer to act on it.
Step 2: Build Your Data Foundation
Start by consolidating supply chain data from all sources:
Internal Systems: ERP (SAP, Oracle, NetSuite), procurement platforms (Coupa, Ariba), quality management, logistics/TMS, warehouse management
External Data Feeds: Financial risk providers (D&B, Bloomberg), weather APIs, news monitoring, industry databases, customs/trade data
Target Architecture: Modern data warehouse (Azure Synapse, Snowflake, BigQuery) feeding Power BI or Looker dashboards
This consolidation typically takes 6-12 weeks for enterprise implementations. The output: a single source of truth replacing dozens of disconnected spreadsheets.
Step 3: Implement Predictive Risk Scoring
Build ML models analyzing your historical disruption data combined with supplier characteristics to predict future failures. Our standard model uses 40+ variables across financial health, operational performance, external factors, and behavioral signals.
The model outputs daily risk scores (0-100) for each supplier with confidence intervals. Scores above 70 trigger monitoring protocols; scores above 85 trigger contingency activation.
Step 4: Deploy Monitoring Dashboards
Create role-specific Power BI dashboards:
Executive Dashboard: High-level risk exposure summary, top 10 at-risk suppliers, trend analysis, cost of disruptions prevented
Procurement Dashboard: Detailed supplier scorecards, performance trends, alert management, alternative supplier recommendations
Operations Dashboard: Real-time supply status, shipment tracking, production risk exposure, inventory adequacy vs. risk
Step 5: Establish Governance and Continuous Improvement
Form a cross-functional supply chain risk committee meeting weekly or biweekly to review alerts, approve mitigation actions, and refine models based on actual outcomes.
The most successful implementations treat this as an ongoing capability, not a one-time project. Models improve as they learn from each disruption; dashboards evolve as business needs change.
Measuring Supply Chain Risk Management Success
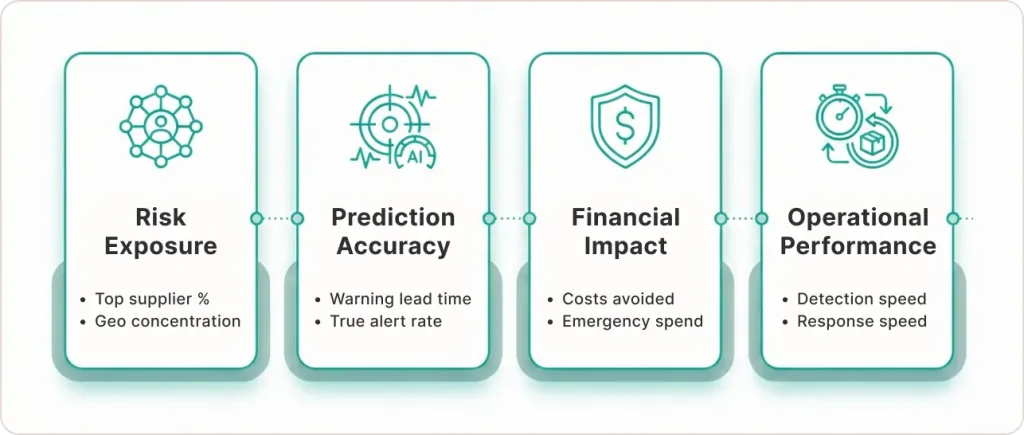
Risk Exposure Metrics:
- Supplier concentration index (% of spend with top suppliers)
- Geographic concentration score
- Number of sole-source components
- Average supplier financial health score
Prediction Accuracy:
- Lead time for disruption prediction (days of advance warning)
- Prediction accuracy rate (% of flagged suppliers that actually failed)
- False positive rate (flagged suppliers that didn’t fail)
Financial Impact:
- Disruption costs avoided through early intervention
- Emergency procurement cost reduction
- Inventory optimization savings
- Overall supply chain risk management ROI
Operational Performance:
- Time to detect supply chain risk incidents
- Time to activate mitigation responses
- Supplier-caused stockout reduction
- Production line-down frequency reduction
One manufacturing client tracking these metrics documented $8.3M in avoided costs during their first year, driven primarily by four proactive supplier transitions that prevented emergency situations.
Why Most Companies Fail at Supply Chain Risk Management
After 50+ implementations, I’ve identified the three failure patterns:
1. They treat it as a strategy problem instead of a data problem. They hire consultants to develop beautiful risk frameworks and policies, but lack the data infrastructure to execute them. Strategy without visibility is useless.
2. They build dashboards but not intelligence. They consolidate data into pretty visualizations showing historical performance, but no predictive capability. Dashboards that only show what happened yesterday don’t prevent tomorrow’s crisis.
3. They rely on point solutions instead of integrated platforms. They buy supplier financial monitoring from one vendor, logistics tracking from another, quality management from a third—creating new silos instead of unified intelligence.
The companies succeeding treat supply chain risk assessment as a core analytics capability requiring data engineering, modeling expertise, and ongoing refinement—not a procurement process improvement initiative.
How to Get Started with Data-Driven SCRM
Want to assess your supply chain risk data maturity? Start with these three diagnostic questions:
Question 1: If your largest supplier filed for bankruptcy tomorrow, how would you find out?
- Answer A: “Their account manager would call us” = You’re reactive
- Answer B: “Our quarterly financial review would catch it” = You’re 90 days too late
- Answer C: “Our predictive model would have flagged it 90+ days ago” = You’re data-driven
Question 2: How long does it take to answer “Which suppliers pose the highest risk today?”
- Answer A: “We’d need to pull data from 5+ systems and spend a week analyzing” = Data problem
- Answer B: “Our dashboard shows real-time risk scores—30 seconds” = Solved
Question 3: When external events occur (weather, geopolitics, market shifts), how do you assess supplier impact?
- Answer A: “We manually contact suppliers to check status” = Reactive
- Answer B: “Our system automatically flags affected suppliers with exposure analysis” = Proactive
If you answered mostly A or B, you have significant opportunity to transform supply chain risk management through better analytics.
The path forward: Start with your highest-risk category (typically either financial risk or geographic concentration), build proof of concept showing ROI, then expand systematically across your risk landscape.