Highlight
- Descriptive Analytics summarizes historical data to understand past performance and current trends through dashboards and reports
- Diagnostic Analytics investigates root causes and relationships in data to explain why specific outcomes occurred
- Predictive Analytics uses machine learning and statistical models to forecast future outcomes with confidence levels
- Prescriptive Analytics recommends optimal actions through AI simulations and optimization algorithms
- Analytics Maturity Model progression prevents organizations from skipping critical foundational stages
- Implementation Strategy requires clean data infrastructure, proper talent, and incremental advancement through each type
Have you ever wondered why some companies seem to always be one step ahead of market changes while others constantly react to problems after they’ve already happened? The answer usually comes down to how they use their data.
Did you know that 81% of companies lack a clear data strategy? Yet the organizations that do master analytics see remarkable results. In my experience working with everyone from Fortune 500 manufacturers to fast-growing SaaS companies, I’ve seen the same pattern repeatedly. Companies get excited about predictive AI and machine learning, but they stumble because they haven’t mastered the basics.
The 4 types of analytics—descriptive, diagnostic, predictive, and prescriptive—aren’t just academic categories. They represent a practical roadmap for building modern analytics capabilities that actually drive business results. When you understand this progression, you can avoid the costly mistakes other organizations make.
Quick Answer:
The 4 types of analytics—descriptive, diagnostic, predictive, and prescriptive—work as a progression where each builds on the previous. Descriptive analytics answers “what happened,” diagnostic explains “why it happened,” predicts “what will happen,” and prescriptively recommends “what to do about it.” Companies that implement all 4 types strategically see 73% faster insights and 15% revenue growth through data-driven decision making.
What Are the 4 Types of Analytics?
Think of analytics as asking 4 fundamental questions about your business:
- Descriptive Analytics: “What happened?”
- Diagnostic Analytics: “Why did it happen?”
- Predictive Analytics: “What might happen next?”
- Prescriptive Analytics: “What should we do about it?”
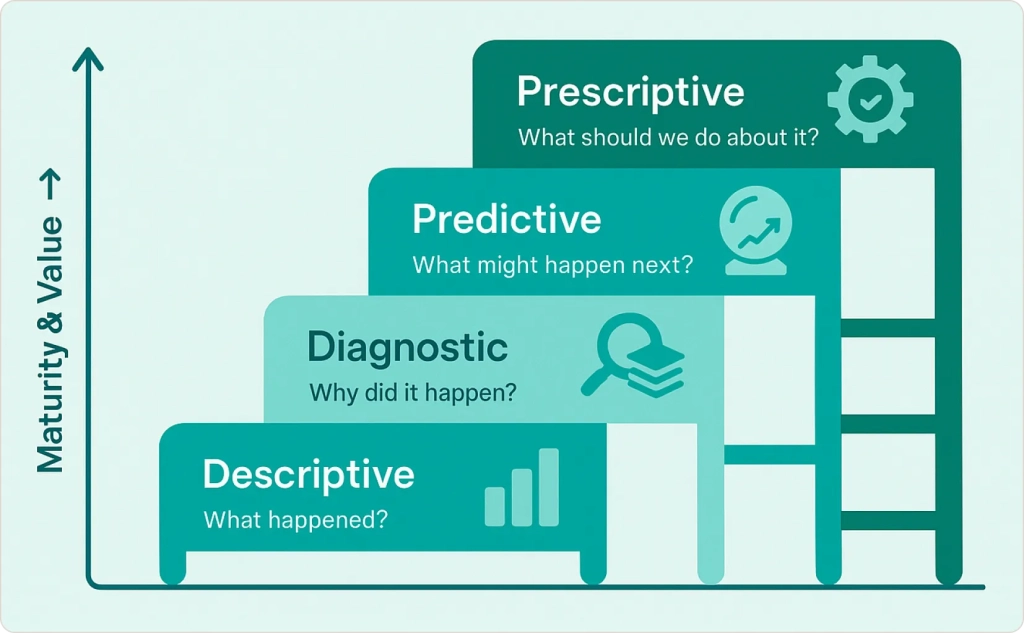
These types build on each other like floors in a building. You can’t effectively predict the future if you don’t understand your past. You can’t make optimal decisions without reliable forecasts. Each analytics type serves a specific purpose in your data-driven decision making process.
According to recent research from Wavestone, 87.9% of executives prioritize analytics investment, yet many struggle with implementation because they try to skip ahead without building proper foundations.
Descriptive Analytics: Understanding What Happened
What is Descriptive Analytics?
Descriptive analytics transforms raw data into meaningful summaries that tell you what happened in your business. It’s the foundation of all analytics—the “reporting” layer that most companies start with.
Here’s what I tell clients: if your business was a movie, descriptive analytics would be the synopsis. It gives you the key plot points but doesn’t explain character motivations or predict the sequel.
How Descriptive Analytics Works
The process involves several key techniques:
Data Aggregation & Summarization: Combining data from multiple sources (sales systems, web analytics, customer databases) to create unified metrics like total revenue, average order value, or customer acquisition cost.
Reporting & Dashboards: Creating visual representations of key performance indicators (KPIs) through business intelligence tools. A client recently told me their executive dashboard reduced monthly reporting time from 40 hours to 4 hours.
Trend Analysis: Identifying patterns over time, such as seasonal fluctuations in sales or website traffic patterns by day of week.
Real-World Example: E-commerce Dashboard
One of our retail clients was drowning in data from their online store, marketplaces, and brick-and-mortar locations. We built a descriptive analytics solution that showed:
- Daily sales performance across all channels
- Top-performing products by category and geography
- Customer acquisition trends by marketing channel
- Inventory levels with automated alerts for low stock
The result? They could finally see their business clearly. “We went from making decisions based on gut feelings to having real data,” their CEO told me. “For the first time, we knew which marketing campaigns actually worked.”
Why Descriptive Analytics Matters
Without solid descriptive analytics, you’re flying blind. I’ve seen companies rush into predictive analytics without understanding their baseline performance. It never ends well.
Important: Garbage in, garbage out. If your descriptive data is inaccurate—like one client who discovered their sales data excluded returns—every analysis built on top will be flawed.
Tools and Best Practices
Modern descriptive analytics relies on business intelligence platforms like Power BI, Tableau, or Looker.
Diagnostic Analytics: Uncovering Why It Happened
What is Diagnostic Analytics?
If descriptive analytics tells you what happened, diagnostic analytics explains why it happened. This is where you move from observation to investigation.
Think of it as detective work. You’ve identified that sales dropped 15% last month (descriptive), but diagnostic analytics helps you discover it was because a key product went out of stock, which coincided with your biggest marketing campaign.
How Diagnostic Analytics Works
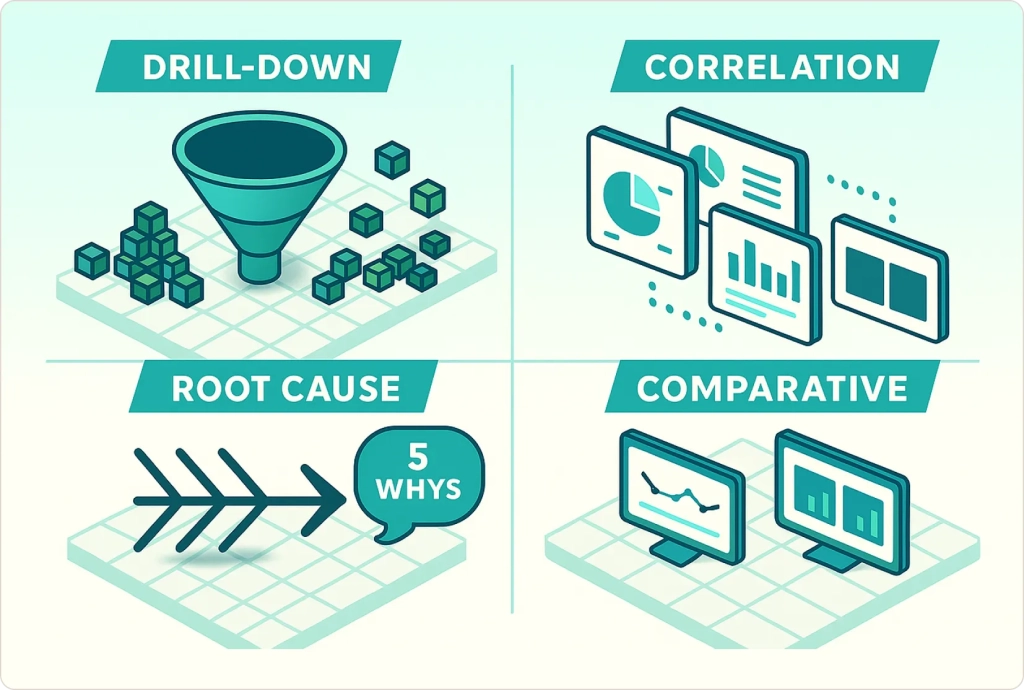
Drill-Down Analysis: Breaking data into segments to isolate factors. For example, if overall conversion rates dropped, you might analyze by traffic source, device type, or geography to find the root cause.
Correlation Analysis: Identifying relationships between variables. Does customer satisfaction correlate with support response time? Do website page load speeds affect bounce rates?
Root Cause Techniques: Methods like the “5 Whys” framework, fishbone diagrams, and statistical hypothesis testing help identify the fundamental drivers behind observed changes.
Comparative Analysis: We compare performance across different segments, time periods, or scenarios to understand what factors differentiate good performance from poor results.
Diagnostic Analytics in Action
A manufacturing client noticed their production efficiency had declined 8% over six months. Using diagnostic analytics, we discovered:
- What: Efficiency dropped from 92% to 84%
- When: Decline started in March and accelerated in May
- Where: Only affecting the second shift
- Why: New quality control procedures added 12 minutes per unit, but only the second shift was following them correctly
This insight led to better training and standardized processes across all shifts.
Why Companies Skip Diagnostic (And Why They Shouldn’t)
Here’s something I’ve observed repeatedly: companies want to jump straight from descriptive to predictive analytics. They see the glamour in AI forecasting but skip the unglamorous work of understanding their current performance.
As one Analytics8 consultant noted, “I see most customers attempting to go from ‘what happened’ to ‘what will happen’ without understanding why it happened.” This leads to predictive models built on false assumptions.
Advanced Diagnostic Tools
Modern BI tools offer built-in diagnostic capabilities. Power BI’s Key Influencers visual can automatically identify factors that drive changes in your metrics. ThoughtSpot’s “Spotter” feature answers diagnostic questions in plain English.
Organizations looking to strengthen their diagnostic capabilities often benefit from comprehensive business intelligence strategy development to ensure all analytics types work together effectively.
Predictive Analytics: Anticipating What Might Happen
What is Predictive Analytics?
Predictive analytics uses historical data, statistical algorithms, and machine learning to forecast future outcomes. Unlike a crystal ball, it provides probabilistic insights—telling you what’s likely to happen, not what will happen.
I always emphasize to clients: predictive models give you informed estimates, often with confidence levels. A model might predict 85% probability of customer churn—there’s still a 15% chance you’re wrong.
How Predictive Analytics Works
The process typically follows these steps:
- Define the Problem: What specifically do you want to predict? Customer churn, inventory demand, equipment failure?
- Gather Historical Data: Collect relevant data that might influence the outcome you’re trying to predict.
- Feature Engineering: Select and prepare the variables (features) that will go into your model.
- Model Selection: Choose algorithms like linear regression, decision trees, or neural networks based on your data and problem type.
- Training & Validation: Train the model on historical data and test its accuracy on unseen data.
- Deployment & Monitoring: Apply the model to new data and continuously monitor its performance.
Predictive Analytics Examples
Customer Churn Prevention: A telecom client used predictive analytics to identify customers likely to cancel their service. By analyzing usage patterns, support tickets, and billing history, they could predict churn with 84% accuracy and proactively offer retention incentives.
Demand Forecasting: A retail chain improved inventory management by predicting product demand at the store level. This reduced stockouts by 25% while cutting excess inventory by 30%.
Equipment Maintenance: A manufacturing company used IoT sensor data to predict when machines would likely fail. This predictive maintenance approach reduced unplanned downtime by 40%.
Many organizations find success by partnering with experienced data science consulting services to implement their first predictive models effectively.
The ROI of Predictive Analytics
According to McKinsey research, companies using customer analytics are 23 times more likely to outperform competitors in customer acquisition. The key is starting with focused use cases where predictions clearly drive business value.
Limitations and Considerations
Accuracy Isn’t Certainty: Even the best models have error rates. Always communicate confidence levels and prepare for exceptions. As Adobe notes, “Predictive models provide an informed prediction, often with a confidence level—they’re not crystal balls.”
Data Dependencies: Models reflect historical patterns. If market conditions change dramatically (like during COVID-19), predictions may become less reliable.
Overfitting Risks: Complex models can perform perfectly on historical data but fail with new data. This is why validation testing is crucial.
Prescriptive Analytics: Deciding What to Do
What is Prescriptive Analytics?
Prescriptive analytics is the “Holy Grail” of analytics—it doesn’t just predict what might happen, it recommends what you should do about it. Think of it as your data-driven advisor that evaluates different scenarios and suggests optimal actions.
This is where analytics directly drives business decisions. Instead of just knowing that demand will increase 20% next month, prescriptive analytics tells you exactly how much inventory to order, which suppliers to use, and when to place orders to minimize costs.
How Prescriptive Analytics Works
Prescriptive systems typically use:
Optimization Algorithms: Mathematical models that find the best solution among many possibilities. For example, determining the optimal price that maximizes revenue while considering demand elasticity.
Simulation Models: Running thousands of “what-if” scenarios to test different strategies before implementation.
AI Decision Engines: Advanced systems that can automatically execute recommendations, like dynamic pricing algorithms that adjust prices in real-time.
Prescriptive Analytics in Practice
Dynamic Pricing: Airlines use prescriptive analytics to adjust ticket prices based on demand forecasts, competitor pricing, and capacity constraints. The system doesn’t just predict demand—it recommends the exact price that maximizes revenue.
Supply Chain Optimization: A logistics company used prescriptive analytics to optimize delivery routes. The system considered traffic patterns, fuel costs, delivery time windows, and vehicle capacity to recommend routes that reduced costs by 12%.
Healthcare Treatment Plans: Hospitals use prescriptive analytics to recommend treatment protocols based on patient conditions, drug efficacy data, and resource availability.
Why Prescriptive Analytics Is Complex
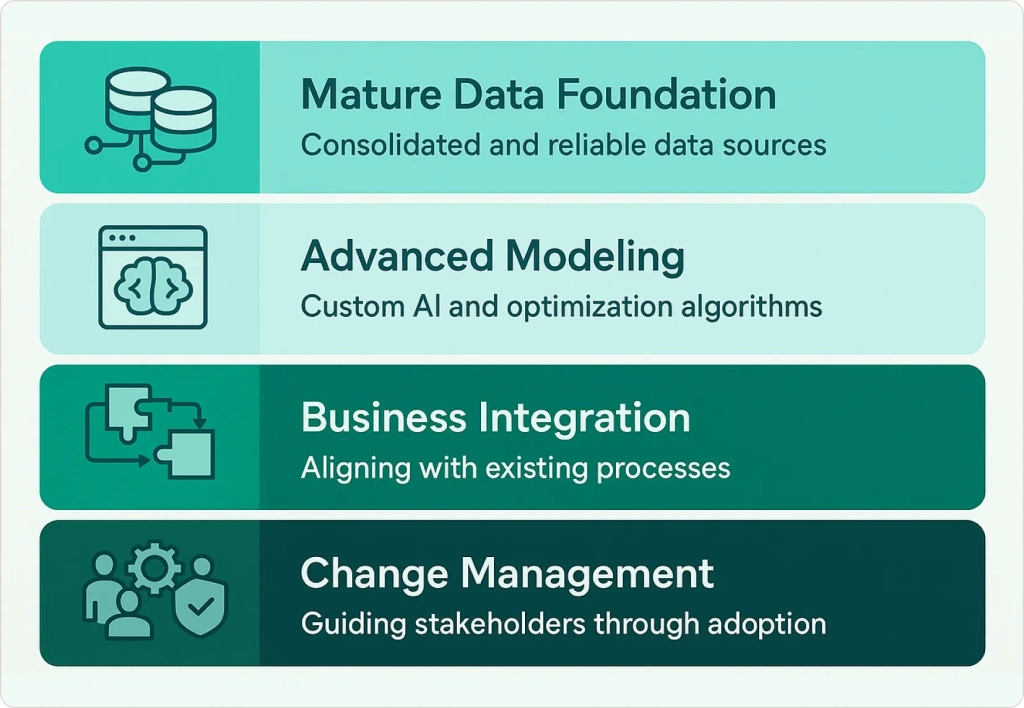
Prescriptive analytics requires the most sophisticated infrastructure and expertise. You need:
- Mature Data Foundation: Clean, integrated data from all relevant systems
- Advanced Modeling Capabilities: Often requires custom development
- Business Process Integration: Recommendations must fit into existing workflows
- Change Management: Teams must trust and act on algorithmic recommendations
Companies seeking to implement prescriptive analytics often benefit from comprehensive data visualization services to make complex recommendations accessible to decision-makers.
Quick Comparison: Descriptive vs Diagnostic vs Predictive vs Prescriptive
| Type | Key Question | Purpose | Example |
|---|---|---|---|
| Descriptive | “What happened?” | Summarize past data & performance | Last quarter’s sales by region (KPI reports) |
| Diagnostic | “Why did it happen?” | Find root causes of past results | Sales dropped because a product line was discontinued |
| Predictive | “What might happen?” | Forecast future outcomes | Predicting next quarter’s sales will grow 5% |
| Prescriptive | “What should we do?” | Recommend actions for optimal results | Suggest increasing production of high-demand items |
Common Pitfalls in Analytics Implementation (And How to Avoid Them)
After working with dozens of companies on their analytics journey, I’ve seen the same mistakes repeatedly. Here’s how to avoid them:
Skipping the Basics
The Problem: Companies rush into advanced analytics without solid descriptive and diagnostic foundations.
The Solution: Ensure you have accurate, accessible data and understand your current performance before building predictive models. One client spent $200K on a machine learning platform that failed because their underlying data was inconsistent.
Confusing Correlation with Causation
The Problem: Just because two metrics move together doesn’t mean one causes the other.
The Solution: Use controlled experiments (A/B testing) and domain expertise to validate causal relationships. Always ask: “Could there be another explanation for this pattern?”
Overfitting Predictive Models
The Problem: Models that work perfectly on historical data but fail with new data.
The Solution: Always validate models on unseen data and monitor performance over time. Keep models as simple as possible while still being effective.
Ignoring Data Quality
The Problem: Building analytics on poor-quality data leads to incorrect insights.
The Solution: Invest in data engineering and governance. Clean, consistent data is the foundation of reliable analytics. According to IBM research, poor data quality costs the US economy $3.1 trillion annually.
Lack of User Adoption
The Problem: Building sophisticated analytics that nobody actually uses.
The Solution: Involve end users in the design process and provide proper training. Create “data champions” within each department who can advocate for analytics adoption.
The most effective way to avoid these costly mistakes is working with data analytics consulting services that have guided hundreds of implementations. We can help you assess your data readiness, choose appropriate tools, and build change management processes that ensure adoption.
Future Trends in Analytics
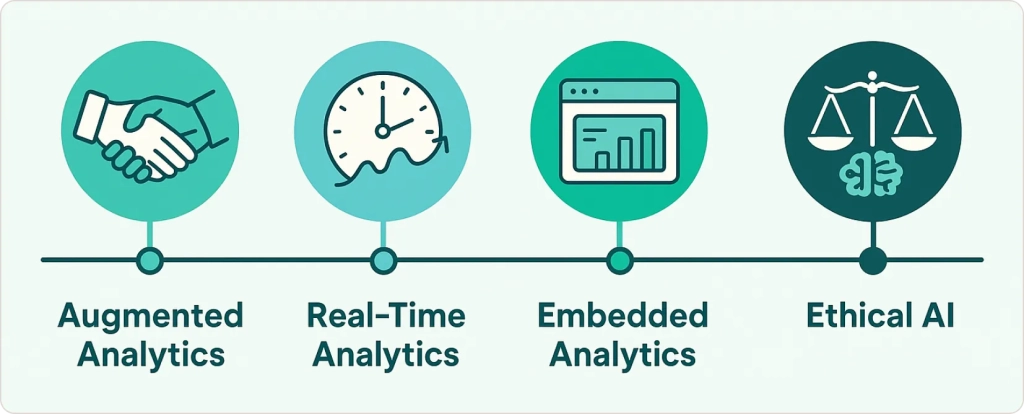
Augmented Analytics
AI will increasingly assist human analysts by automating routine tasks, suggesting analytical approaches, and highlighting significant insights. This augmentation allows analysts to focus on strategic interpretation rather than technical execution.
Real-Time Analytics
Streaming data technologies enable real-time analysis and decision-making. This is particularly valuable for applications like fraud detection, dynamic pricing, and operational monitoring.
Embedded Analytics
Analytics capabilities are being built directly into business applications, making insights available within existing workflows rather than requiring separate analytical tools.
Ethical AI and Explainable Analytics
As analytics influence more business decisions, organizations need systems that can explain their reasoning and ensure fair, unbiased outcomes.
For organizations ready to embrace advanced analytics, our guide on implementing business intelligence in 2025 provides a comprehensive roadmap for success.
Industry Expert Insight
“The organizations that succeed with analytics don’t just collect data—they build it into their decision-making DNA. Every meeting starts with ‘What does the data tell us?’ rather than ‘What do we think?'” – Research from Harvard Business School shows that data-driven companies are 5% more productive and 6% more profitable than their competitors.
💡Learn more about building data-driven cultures in our business intelligence strategy guide.
Turning Insights into Action: Your Analytics Journey Forward
Data by itself won’t drive change—it’s how you analyze and act on it that counts. By now, you understand that descriptive analytics gives you the “what,” diagnostic provides the “why,” predictive suggests “what’s next,” and prescriptive tells you “what to do.”
The most successful organizations treat analytics as a continuous journey rather than a destination. They measure, question, forecast, and optimize continuously. Whether you’re setting up basic reports or fine-tuning AI-driven recommendations, every step up the analytics ladder moves you toward smarter decisions.
Remember: 81% of companies lack a clear data strategy. With this knowledge, you’re equipped to be among the 19% who get it right.