TL;DR
- 95% of data teams are at or above capacity. The bottleneck is structural, not a talent problem.
- Teams that break free measure contribution in business outcomes, not dashboards shipped.
- Operating model choice (centralized, decentralized, hybrid) has more long-term impact than tech stack.
- This guide gives you the DRIVE framework, a 90-day action plan, a role-hiring sequence, one decision table, and an ROI scorecard for your next budget conversation.
Quick Answer
A data analytics team is a group of data engineers, analysts, and scientists who build data pipelines, analyze business data, and deliver insights that directly inform organizational decisions and measurable outcomes.
I have spent years inside analytics functions that were well-funded, technically capable, and still failing the business. The pattern is always the same. Engineers maintain pipelines they did not build. Analysts answer the same questions every week. The data science team has not shipped a production model in months. The team is busy. It is not useful.
The fix is never the tooling. It is the architecture: how the team is structured, what it measures, how work enters and exits the system, and how results reach the people who control the budget. This guide is for Heads of Data, CDOs, and founders who are building from scratch or rescuing a function that has drifted into reactive mode.
The framework I will walk you through is called DRIVE: Define outcomes. Roles and ratios. Intake and prioritization. Value measurement. Execution cadence.
What Is a Data Analytics Team and What Should It Deliver?
A data analytics team collects, transforms, and interprets organizational data to support better, faster business decisions. It spans three core functions: data engineering (pipelines), analytics (interpretation), and data science (modeling and prediction). The purpose is not to produce dashboards. It is to improve the quality and speed of decisions that drive revenue, retention, and efficiency.
Most teams get this backwards. They optimize for output volume because that is what is easy to report. Tickets closed. Dashboards published. Queries answered. None of those metrics tell you whether the business made a better decision because of the team’s work.
The DRIVE Framework: Define outcomes. Roles and ratios. Intake and prioritization. Value measurement. Execution cadence. These five elements separate a reactive report shop from a team that compounds business value.
According to Gartner’s 2025 CDAO Agenda Survey, the percentage of Chief Data and Analytics Officers (CDAOs) reporting directly to the CEO increased from 21% to 36% within one year. Gartner also projects that by 2027, 75% of CDAOs who are not viewed as essential to their organization’s AI strategy will lose their C-level positions. The analytics teams that earn board-level trust share one characteristic: they can name a specific decision that was made differently, faster, or more confidently because of their work.
Which Data Analytics Team Structure Works at Your Stage?
The right structure is at 15 employees, with breaks at 150. Here is the practical breakdown with a clear default recommendation.
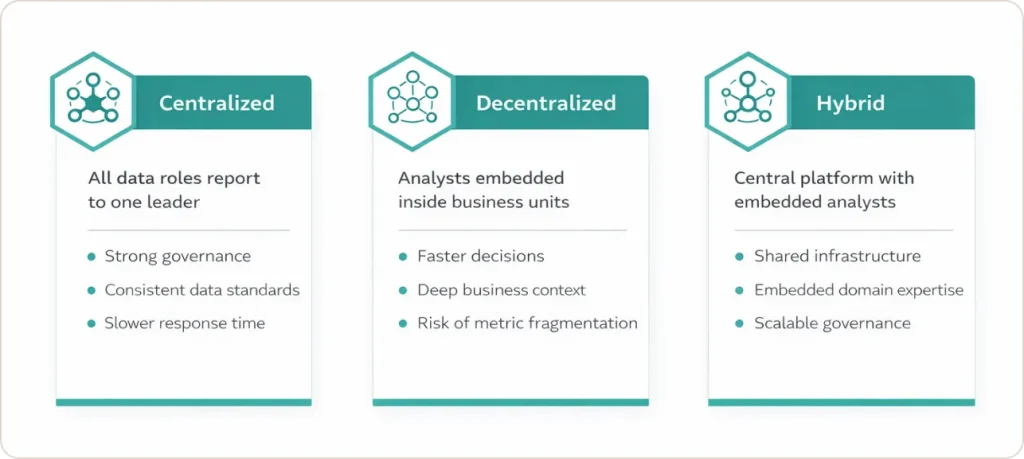
Centralized: Governance First, Speed Second
All roles report to one data leader. Standards and governance are unified. Business units queue for support. This works in early-stage companies (under 50 employees) and regulated industries where data quality is non-negotiable.
Decentralized: Speed First, Standards Second
Analysts embed inside business units and report to functional leaders. Context is deep, response time is fast. The cost is fragmentation: metric definitions drift, pipelines get rebuilt four times. For retail and CPG companies, this model typically transitions to hybrid once scale exceeds what informal coordination can hold together.
Hybrid: The Default for Scaling Organizations
A central team owns infrastructure, governance, and standards. Analysts sit inside business units. Senior practitioners act as domain leads. Gartner identifies this as the Expert D&A Leader archetype: a cross-functional function with a holistic view of data quality. For healthcare and financial services organizations, the hybrid model provides the clearest path to compliant, auditable pipelines.
| Model | Best For | Strength | Risk | Use This? |
|---|---|---|---|---|
| Centralized | Under 50 employees, regulated industries | Governance, consistency | Slow response, business disconnect | Early stage only |
| Decentralized | Franchise models, high-autonomy units | Speed, domain context | Metric fragmentation, duplicated work | Not at scale |
| Hybrid | Series B+, multi-product orgs | Balanced speed and rigor | Requires strong coordination | Yes, default choice |
| Domain-Based | Enterprises with 10+ data staff | Per-domain alignment | High headcount requirement | When hybrid matures |
Domain-based evolves from a mature hybrid. It is not a starting point.
What Roles Does a Data Analytics Team Need, and In What Order?
Role ambiguity is one of the top drivers of data team failure. Engineers doing analyst work. Analysts building pipelines. Scientists debugging SQL. The problem is rarely talent. It is a hiring sequence that was not tied to what the organization needed next.
- First hire: Data Engineer or Analytics Engineer. Data engineering is the foundation that determines how much analytical work can be trusted. Do not hire a data scientist first.
- Second hire: Domain-aligned Data Analyst. Translates reliable data into answers for the function with the highest-stakes decisions: usually finance, product, or growth.
- Third hire: Data Governance Specialist. Every team hires this role too late. Metric inconsistency is invisible until it destroys stakeholder trust. This hire prevents it structurally.
- Fourth hire: Analytics Engineer or Data Scientist. Data science only generates defensible value when the underlying data is clean and the team has capacity to maintain production models.
- Fifth hire onward: Data Platform Engineer, ML Engineer, domain analysts. These make sense once use cases are defined and the operating system is functioning.
On sizing: a practical benchmark is 4 to 10 data analysts per data engineer with moderate self-service tooling. Analytics engineers scale at 2:1 relative to data engineers.
The first hire determines the ceiling. If that person cannot build and maintain a reliable pipeline, every downstream hire works on a foundation that breaks under pressure. Start with infrastructure.
“Data teams focus on outcomes, not outputs. The question is never how many dashboards we shipped. It is what decisions improved because of our work.” Solmaz Shahalizadeh, former Head of Data at Shopify | BVP Atlas
What Should a New Head of Data Do in the First 90 Days?
A Gartner study found that CDOs with business-facing KPIs and multiple business partners are 1.7 times more likely to demonstrate clear ROI from data investments than those who focus primarily on technology. Average data leader tenure is approximately 30 months. Here is how to use the first 90 days.
Days 1 to 30: Earn the Right to Act
Do not build anything. Conduct 30-minute conversations with 15 to 20 stakeholders across every function. Ask three questions: what is working, what is broken, what is the highest priority. Deliver a relationship map, a gap analysis, and a data asset audit. The most valuable output of this phase is the fact that you listened before you acted.
Days 31 to 60: Remove a Specific Pain
Pick two or three high-priority fixes achievable in two weeks: a broken report no one trusts, a metric definition conflict that causes board-meeting arguments, a dataset three teams rebuild manually every week. Document the before and after. Communicate broadly. For teams in financial services or manufacturing, these early wins also build the compliance credibility needed for governance conversations later.
Days 61 to 90: Ship a Strategy, Not a Tech Plan
Produce a business-aligned roadmap: current-state assessment, three to five strategic objectives tied to measurable outcomes, and a prioritized initiative list for the next 12 to 24 months. Present it to the senior leadership team before it is finalized. A strategy document that leadership sees for the first time in a board deck is already a problem.
How Do You Build the Operating System That Runs the Team?
Every competitor blog covers org models and role lists. Almost none explain how the team operates day to day. That gap is what causes well-structured analytics teams to become reactive queues within six months of being built. The operating system has four components.
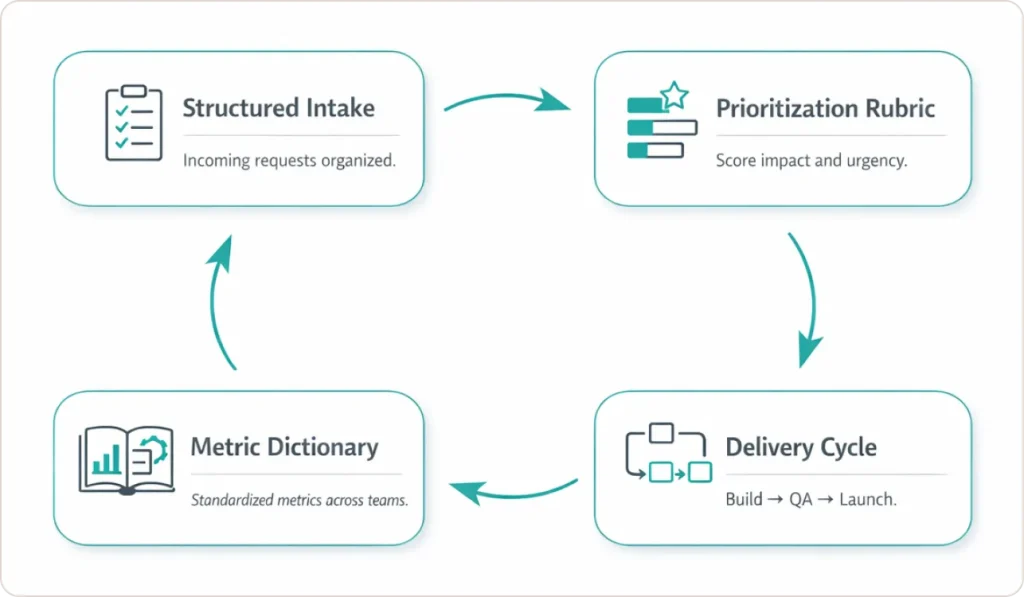
Structured Intake
Every request must answer three questions before it is accepted: what specific decision will this inform, who is the named decision-maker, and what does a useful answer look like. A shared form with five fields, reviewed in a weekly triage meeting, handles most teams under 15 people. For sales and marketing analytics functions, intake discipline is particularly important because marketing stakeholders generate high request volume with varying decision clarity.
Prioritization Rubric
Weight every request across four dimensions: business impact (value of the decision enabled), urgency (time sensitivity), reusability (can this serve multiple stakeholders), and strategic alignment (does it connect to a company priority). Score each 1 to 3. The rubric gives the Head of Data a documented, defensible basis for deprioritizing low-value work without creating political conflict.
Delivery Cycle
Run every piece of work through: discovery, definition, build, QA, launch, and adoption tracking. Publishing a dashboard is not delivery. Delivery is confirmed when the decision-maker is using the output and the downstream decision has been made.
Metric Dictionary
Define every business metric once, in one place, with a named owner. Finance reporting one revenue number while Marketing reports another destroys trust in the entire data function. A shared metric dictionary, paired with consistent data visualization standards that make definitions visible in every dashboard, prevents this structurally.
How Do You Prove the ROI of a Data Analytics Team?
Without a clear answer, the team’s budget is the first line reviewed in a cost-reduction meeting. The teams that survive those reviews built their measurement system before they needed it.
The Fibonacci Skills Matrix
Rate proficiency using the Fibonacci sequence (0, 1, 2, 3, 5, 8) rather than a linear scale. The non-linear progression reflects how mastery actually develops: moving from 5 to 8 is a fundamentally different leap than 1 to 3. Multiply each proficiency score by a desire rating (0 or 1) to get a holistic competency score. Applied across the team, the matrix maps capability against your prioritized initiative list and quantifies gaps with a cost and timeline attached.
The Business Impact Scorecard
Track five categories: adoption (are stakeholders using what the team built), cycle time (request to decision, not delivery), automation impact (hours reclaimed per week), business outcomes (results attributable to a specific model), and data trust (metric consistency across the organization).
One client example documented in the SR Analytics success stories library: an inventory management engagement resulted in 30% excess inventory reduction and 0.5 FTE saved through automation. The team earned credit because they tracked the decision the dashboard enabled, not just the dashboard itself.
ROI formula: (Direct Benefits + Indirect Benefits – Total Costs) / Total Costs x 100. A Forrester Total Economic Impact study on a composite analytics engineering deployment found 194% ROI with breakeven in six months.
Forrester’s 2025 State of Data and Analytics report identifies productized data and business‑outcome alignment as the top differentiators between organizations that demonstrate clear analytics ROI and those still struggling to make the case.
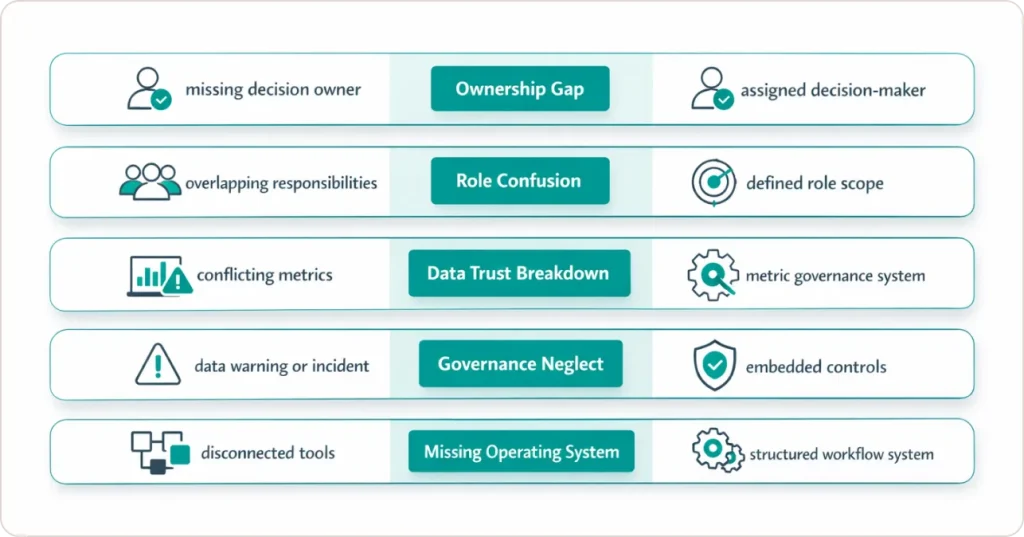
Why Do Most Data Analytics Teams Fail?
- No named business owner. The team produces work no one was waiting for. Fix: require a named decision-maker in every intake request.
- Role ambiguity. Engineers do analyst work, analysts build pipelines, scientists debug SQL. Fix: define role scope before hiring, enforce it through intake.
- Metric inconsistency. Finance and Marketing report different numbers. Once stakeholders stop trusting data, no modeling recovers that trust quickly. Fix: a metric dictionary with named owners, reviewed quarterly.
- Governance deferred. Teams that skip data quality controls pay for it in a data incident at the worst possible time. Fix: embed light governance into the delivery cycle from day one.
- Operating system skipped. Roles hired, structure chosen, tools purchased. No intake, no rubric, no delivery cycle. Fix: build the system before the crisis, not in response to it.
The Decisions That Determine Whether Your Data Team Compounds or Stagnates
Organizations that get lasting value from their data analytics team treated team design as seriously as product design. Operating model, hiring sequence, intake system, metric dictionary, and measurement framework are all decisions with compounding consequences. Get them right early and the team builds on itself. Get them wrong and you spend the next two years in damage control.
The DRIVE framework is the architecture that separates teams earning board-level credibility from teams fighting for budget in every planning cycle. None of it requires a large team or an enterprise toolset. It requires clarity about what you are trying to achieve and the discipline to measure whether you are achieving it.
SR Analytics has worked through these decisions with companies across retail, healthcare, financial services, and manufacturing. The success stories page shows what those outcomes look like in practice.