TL;DR
- MIT Project NANDA (July 2025): 95% of organizations deploying generative AI saw zero measurable return. Not low return. Zero.
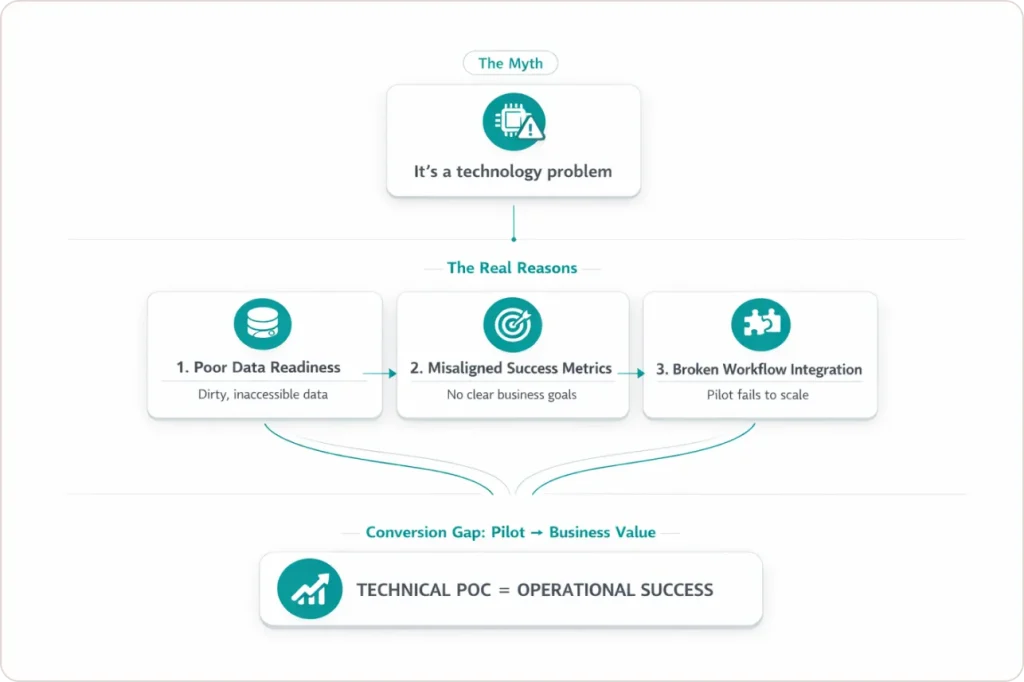
- The failure is almost never the model. It is data readiness, workflow integration, and the absence of a defined outcome before build starts.
- Gartner predicts 60% of AI projects lacking AI-ready data will be abandoned through 2026. That rate is already at 42% of U.S. companies.
- This post gives you a four-phase framework to move a stalled AI project to production in 12 weeks.
Quick Answer
Most AI projects fail because organizations cannot convert pilots into measurable business value. The primary causes are poor data readiness, misaligned success metrics, and broken workflow integration. The underlying technology is rarely the reason a project fails.
I have been in a lot of post-mortem meetings where nobody calls the AI initiative what it was: a failure. They call it a learning. The pilot is wrapped up, the budget is reallocated, and six months later, a new pilot starts with the same unresolved data problems underneath it.
After working through AI readiness projects with enterprise data teams across multiple industries, I have stopped being surprised by the failure rate. What surprises me is how consistently organizations misdiagnose the cause. The reality is that the data infrastructure was never ready for production.
The GenAI Divide: State of AI in Business 2025, a preliminary report from MIT’s Project NANDA. confirmed this in July 2025. Their research, covering 300-plus AI initiatives through practitioner interviews and structured surveys, found that 95% of organizations saw zero measurable return from generative AI. A 5% minority is generating real P&L impact. This post explains what separates those two groups.
What Does “95% of AI Projects Fail” Actually Mean?
The 95% figure is not about models breaking. MIT defines “successfully implemented” AI as systems that deliver sustained productivity gains and documented P&L impact, verified by both end users and executives. By that standard, most enterprise AI deployments in 2026 do not qualify. The statistic measures value realization, and most organizations are generating none.
Three numbers tell the same story from different angles:
| Statistic | Figure | Source |
|---|---|---|
| U.S. companies that abandoned most AI initiatives | 42% (up from 17% the prior year) | S&P Global Market Intelligence via CIO Dive, 2025 |
| AI proofs of concept scrapped before reaching production | 46% | S&P Global Market Intelligence via CIO Dive, 2025 |
| AI projects without AI-ready data predicted to be abandoned through 2026 | 60% | Gartner, February 2025 |
The 42% is the organizational outcome. The 46% is the project-level outcome. The 60% is the forward-looking risk for 2026. Organizations that launched AI pilots in 2022 and 2023 are now in their first serious budget review cycles. When they cannot demonstrate a measurable return, programs are cancelled. The 95% problem is not a prediction. It is the bill coming due.
Is AI Overhyped, or Is the Deployment Model Broken?
The technology is not overhyped, but the assumption of ease is wildly overhyped. Large language models, retrieval-augmented generation, and predictive analytics are genuinely capable of changing how work gets done. The problem is that “deploying a model” and “generating business value from a model” are treated as the same thing. They are not even close.
“The hype on LinkedIn says everything has changed. Nothing fundamental has shifted.” – COO at a large enterprise organization, quoted in MIT Project NANDA research, July 2025
I hear a version of that quote in almost every initial client conversation. The executive team approved an AI budget because the narrative was compelling. The data team is now nine months in with nothing defensible to show. The hype created the investment. The absence of data readiness killed the return.
Vendor demos run on curated datasets with clean schemas and controlled volume. Production runs on years of inconsistent, poorly governed, under-documented data that nobody has cleaned because nobody ever needed to clean it before. That gap is where most AI projects die, and it is a data quality and pipeline integration problem, not a model problem.
The organizations asking “Is AI overhyped?” are usually the ones that watched a clean demo and then a collapsed production deployment. The question they should be asking is: Was our data ready for what we were asking the model to do?
What Are the Real Root Causes When AI Projects Fail?
RAND Corporation’s research, drawn from interviews with 65 experienced AI practitioners across the United States, identified the failure causes that appear most consistently in enterprise AI programs. The most important finding that most vendor content buries: the highest-impact failure cause is not technical. Misaligned incentives and the absence of end-user co-design kill more AI projects than bad models ever will.
| Root Cause | How It Shows Up | Prevention That Works |
|---|---|---|
| Mis-specified problem | Model solves the stated objective. Adoption is still zero. Nobody changed how they work. | Write a use-case charter before build starts. Define the workflow change and measurable outcome, not just the prediction target. |
| Missing or inadequate data | High accuracy in demos. Accuracy collapses in production because training features do not exist in real pipelines. | Run a data asset audit scoped to your specific use case. Not a general inventory. |
| Insufficient infrastructure | POC performs well in dev. Production fails under real data volume and pipeline latency. | Gate infrastructure readiness before sprint one. Define SLAs for pipeline freshness and compute before development begins. |
| Misaligned incentives | End users route around the tool within weeks. Workarounds emerge because nobody asked them what they needed. | Co-design the workflow with the people whose jobs it affects. Adoption is designed in, not assumed at launch. |
| No defined success metrics | The project survives 12 months with no clear answer to whether it is working. | Define a KPI ladder before build: lead metrics as early signals, lag metrics as P&L impact targets at 90 and 180 days. |
The misaligned incentives cause is the one most vendor content skips. MIT’s “learning gap” finding connects directly to it. AI tools with no user feedback mechanism cannot improve after launch, and user disengagement is a documented root cause of AI project abandonment.
Why AI-Ready Data Changes the Failure Rate
Gartner’s February 2025 research produced the clearest operational definition the industry has. AI-ready data is data aligned to specific use cases, actively governed at the asset level, supported by automated pipelines with quality gates, managed through live metadata, and continuously quality-assured. The word “continuously” is where most organizations fall short.
Traditional data management runs at reporting cadences: quarterly audits, annual governance reviews, monthly pipeline checks. AI models in production need data quality signals measured in hours. That mismatch is where most data quality AI problems originate, and it will define which enterprises extract value from AI in 2026.
| Gartner AI-Ready Data Step | What It Requires in Practice | What Happens Without It |
|---|---|---|
| 1. Align data to use cases | Map each data asset to a specific business objective before any build starts. | Expensive data lakes with no use-case anchor. High cost, near-zero production relevance. |
| 2. Establish data governance | Asset-level ownership, access controls, and quality standards, not enterprise-wide policy. | Governance exists in a document. It does not exist in the pipeline or the deployment. |
| 3. Active metadata management | Machine-readable, continuously updated metadata so AI systems can locate and trust what they consume. | Static data catalogs go stale in 60 to 90 days. Models query data they cannot interpret reliably. |
| 4. Reliable data pipelines | Automated, monitored pipelines with SLA-backed freshness guarantees and quality gates at each stage. | Pipelines that work in dev and fail silently under production load and real data volume. |
| 5. Continuous quality assurance | Ongoing anomaly detection, schema drift monitoring, and feedback loops back to source systems. | One-time data cleanup before launch. No process to catch quality degradation after go-live. |
Step 3, active metadata management, is where most data teams push back hardest. Every team I have worked with that skipped it regretted it within three months. Without current, machine-readable metadata, pipelines deliver data that models cannot confidently use. See how our data engineering builds metadata management into pipeline deployments.
The 12-Week Playbook: From Stalled Pilot to Production
Most frameworks name the problems. This one tells you what to do on Monday. The four phases below synthesize MIT’s learning gap analysis, Gartner’s AI-ready data steps, and RAND’s root cause findings into an operating model for lean enterprise data teams.
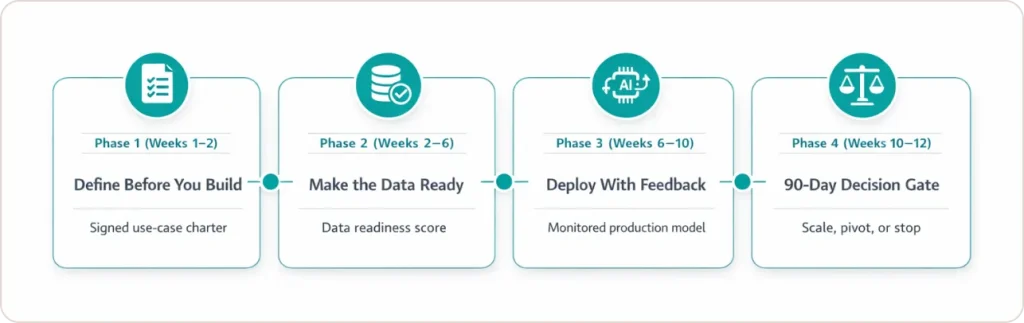
Phase 1: Define Before You Build (Weeks 1-2)
Output: A one-page use-case charter signed by the business owner, data team lead, and executive sponsor.
The charter forces four questions before any technical work starts: What specific business problem are we solving? What does the baseline metric look like today? What is the target KPI? What are the data dependencies and risk gates that would halt the project?
Most organizations skip the KPI ladder. Lead metrics confirm within two weeks whether the model is behaving as intended. Lag metrics are the P&L outcomes you present at the 90-day and 180-day reviews. MIT’s zero-return finding traces directly to organizations that skipped lag metrics. When 2026 budget reviews arrive, they have nothing to present.
Phase 2: Make the Data Ready (Weeks 2-6)
Output: A data readiness score for your specific use case, with documented gaps, named remediation owners, and a pipeline health baseline.
The five steps directly support scoping audits to specific use cases (e.g., avoiding enterprise-wide efforts), aligning with the quote’s emphasis on a “four-week sprint” over six months by focusing on model-dependent datasets. The original press release only warns of 60% project failure rates through 2026 without steps.
This is also the phase where AI projects survive or fail, and almost every team rushes through it. Rushing Phase 2 is the most reliable way to guarantee Phase 3 fails in production.
Phase 3: Deploy With Feedback Loops Built In (Weeks 6-10)
Output: A production-deployed model with monitored inputs, monitored outputs, and a user feedback mechanism active from day one.
MIT’s learning gap finding is specific here. AI tools with no user feedback mechanism cannot improve after deployment. Build the loop before launch: a two-click error flag, a weekly review with the workflow owner, a dashboard showing model confidence alongside outputs.
Input monitoring catches pipeline drift and data quality degradation. Output monitoring catches model drift. Input degradation is how a model that performs well at launch silently deteriorates over three months.
Phase 4: The 90-Day Scale Decision Gate (Weeks 10-12)
Output: A documented, evidence-based decision to scale, pivot, or terminate, presented to the executive sponsor using the KPI ladder as the evaluation framework.
At 90 days, run a formal gate against Phase 1’s KPI ladder. Has the lead metric moved? Is the pipeline holding under production load? Are end users actually using the tool, or have they reverted?
Make one of three calls: scale, pivot and restart the charter, or terminate and redeploy the investment. Terminating a failing POC at week 12 rather than week 52 is one of the clearest behavioral differences between the 5% and the 95%. See how this decision gate works in our client engagement case studies.
5% vs. 95%: What Separates Organizations That Scale AI
| Factor | 95%: Fail to Scale | 5%: Generate P&L Impact |
|---|---|---|
| Problem definition | Aspirational. Defined by what the technology can do. | Specific. Defined by a workflow change and a measurable outcome. |
| Data sequencing | Use case first. Data problems found in production. | Data infrastructure first. Use cases layered on a ready foundation. |
| Success metrics | Defined after launch, or not at all. | KPI ladder built before sprint one. Lead and lag metrics tracked from day one. |
| User involvement | End users consulted late, or never. | Workflow owners co-design the tool. Adoption is built in. |
| Infrastructure | Ad-hoc POC environment rebuilt from scratch each project. | Shared, governed data platform. Each new use case is additive. |
| Feedback loops | No mechanism to improve the model after launch. | Input and output monitoring from day one. User feedback is a product feature. |
| Scale decision | Implicit. Drifts until budget runs out. | Formal 90-day gate. Evidence-based call to scale, pivot, or terminate. |
| Data governance | Reactive. Addressed when a production problem surfaces. | Active metadata, asset-level ownership, continuous quality assurance as standard. |
The 95% Problem Is a Data Problem. It Is Also Solvable.
The organizations stuck in the 95% are not failing because AI technology does not work. They are failing because they built pilots on top of data infrastructure that was never designed to support production AI, defined success after the project launched instead of before, and treated end-user adoption as something that would happen naturally once the model was deployed.
The organizations in the 5% made different choices at the start of the project, not the end. They built data infrastructure before selecting use cases. They defined P&L metrics in week one. They co-designed workflows with the people whose jobs they were changing. None of those choices require a bigger budget. They require a different sequence.
MIT, Gartner, and RAND all point to the same root causes. The diagnosis has been consistent since 2024. The organizations that will report AI-driven P&L gains in 2026 are the ones that stopped running new pilots and started fixing their data foundation first.
If your team is looking at a stalled AI initiative or a POC that never made it past the demo stage, the root cause is almost certainly upstream of the model. Start with the data.