The $800K Dashboard That Showed Three Different Realities
Picture this: A hospital CFO walks into the quarterly board meeting with three printouts. Same metric. Three completely different numbers.
Patient satisfaction according to Operations: 87% According to Clinical Systems: 73% According to the new Epic analytics module they spent $800K implementing: 91%
The CEO asks the obvious question: “Which one is real?”
Nobody knows.
I’ve sat in that exact room 47 times across different companies. The names change. The software changes. The dysfunction is always identical.
After 50,000+ hours consulting on analytics implementations, I can diagnose why your BI tools aren’t working in about 15 minutes. And I can tell you this: It’s never the software.
The Uncomfortable Truth About Why 73% of BI Projects Fail
Here’s what nobody tells you during the Tableau demo or the Power BI sales pitch:
Your BI failure was predetermined the moment you started shopping for tools before defining what decisions you’re trying to improve.
Gartner research indicates that fewer than 30% of BI initiatives completely align analytics with enterprise business drivers—despite alignment being the foremost challenge. The gap isn’t technological; it’s strategic.
According to Gartner’s research on data governance, most organizations struggle with coordinating data and analytics efforts across business units—a fundamental strategy problem, not a technology one.
It’s like hiring contractors before talking to an architect. You’ll definitely build something. Whether it solves your actual problem is pure luck.
But it gets worse. The typical BI implementation creates three failure patterns that compound over time:
The Three Deployment Disasters
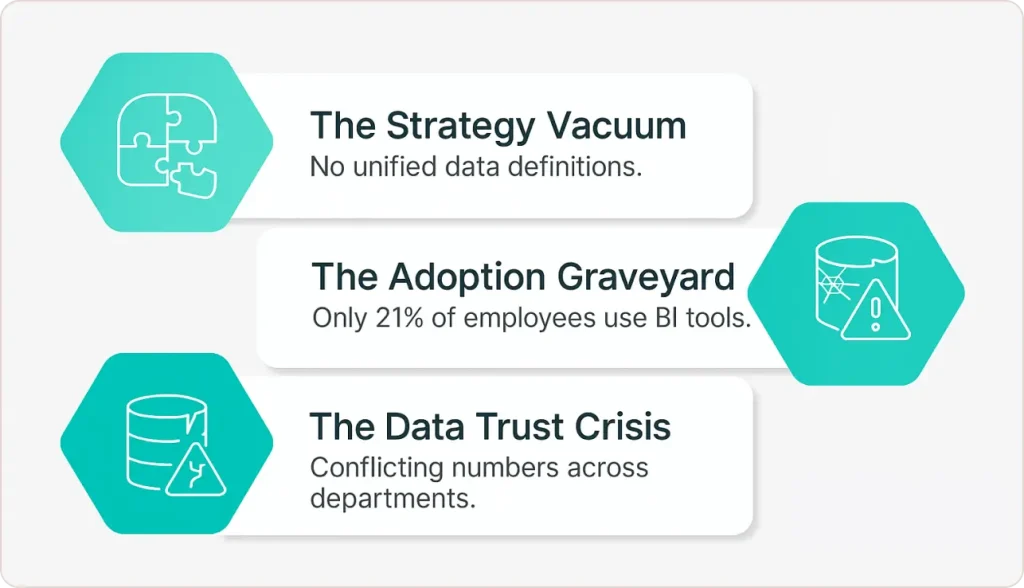
Disaster #1: The Strategy Vacuum
A regional retailer I worked with had three BI tools deployed across departments. Marketing used Tableau. Finance had Power BI. Operations exported Excel reports from their ERP.
Each team generated reports. None of them agreed on “total monthly sales.”
Why? Because nobody had ever defined what “sales” meant. Was it when the order was placed? Shipped? Paid? After returns? Including B2B wholesale?
Without data strategy consulting, you’re not building a data platform. You’re building a Tower of Babel where everyone speaks analytics but nobody communicates.
Disaster #2: The Adoption Graveyard
Studies show only 21% of employees actually use the BI tools their companies deploy.
Think about that. You spent millions on analytics. Four out of five people ignore it completely.
I recently audited a manufacturing company with a gorgeous operations dashboard: 40+ KPIs, color-coded, real-time updates. Beautiful.
Completely useless.
When production delays hit, the dashboard confirmed they were behind schedule. But it couldn’t tell them whether the problem was supply chain, equipment maintenance, or workforce scheduling.
So managers went back to calling people and checking spreadsheets. The dashboard became expensive wallpaper.
Disaster #3: The Data Trust Crisis
A healthcare provider showed me their patient satisfaction dashboards. Interactive, real-time, professionally designed.
The data was calculated three different ways across departments. The warehouse pulled from seven legacy systems with no standardized patient identifiers.
Clinical teams didn’t trust any of it. So they maintained parallel spreadsheets.
Harvard Business Review research confirms that organizational and cultural barriers—not technology—prevent companies from becoming data-driven. Your BI tool is only as trustworthy as the data feeding it. If people don’t trust the numbers, they won’t trust the insights. If they don’t trust the insights, they won’t change behavior. And if behavior doesn’t change, you’ve just built a very expensive art project.
Why Your BI Team Can’t Fix This (And It’s Not Their Fault)
Here’s the structural problem nobody wants to admit:
Your BI team is incentivized to build dashboards, not solve business problems.
Data engineers get promoted for technical complexity. They’re measured on how many pipelines they build, how fast queries run, how sophisticated the architecture looks.
They’re not measured on whether the VP of Sales actually makes better decisions.
This creates a vicious cycle:
- Business asks for a dashboard
- IT builds something technically impressive
- Business users find it too complex
- They request modifications
- Requests pile up in a backlog
- Frustrated business users build shadow spreadsheets
- Multiple versions of truth emerge
- Trust erodes
I’ve watched this pattern destroy analytics initiatives at Fortune 500 companies and startups alike.
The solution isn’t hiring better engineers. It’s fundamentally rethinking how you approach BI implementation through comprehensive data strategy and consulting.
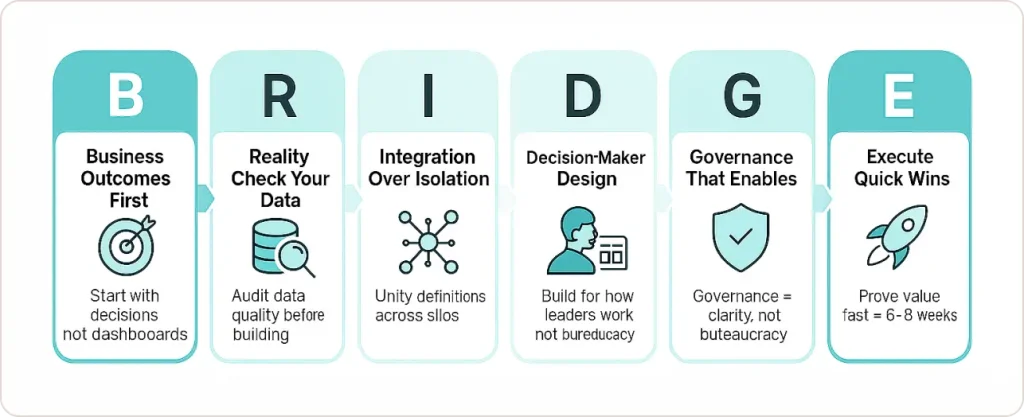
The BRIDGE Framework: Why Strategy Must Come First
After diagnosing 47 failed BI implementations, I developed a framework that addresses the root cause rather than symptoms.
We call it BRIDGE—and it’s the opposite of how most companies deploy analytics:
B – Business Outcomes First Start with decisions, not dashboards. What specific choice will this analytics capability improve? If you can’t answer that in one sentence, you’re not ready to build.
R – Reality Check Your Data Audit data quality before building anything. I’ve never—not once—seen a company accurately assess their data landscape before implementation. The surprises always come after launch.
I – Integration Over Isolation Unified metrics definitions across silos. One source of truth. Non-negotiable. If Marketing and Finance can’t agree on what “customer” means, no dashboard will help.
D – Decision-Maker Design Build for how executives actually work, not how data engineers think they should work. The VP of Sales won’t learn SQL. Design for her workflow or accept failure.
G – Governance That Enables Not bureaucracy—clarity. Who owns customer data? What does “revenue” mean? When is data considered trustworthy? Answer these questions before building pipelines.
E – Execute Quick Wins Prove value in 6-8 weeks, not 18 months. Identify one burning question leadership asks repeatedly but struggles to answer. Solve it definitively. Use that momentum to scale.
What Actually Works: Three Companies That Got It Right
SaaS Company: From Reactive to Predictive
Before: Their “churn dashboard” told them which customers left last month. Accurate but useless—like a smoke detector that only goes off after your house burns down.
After BRIDGE: We unified customer data across platforms through big data strategy consulting, defined churn risk indicators, and built predictive models identifying at-risk accounts 90 days early with automated workflows alerting account managers.
Result: 18% churn reduction in six months. Same BI tool. Different strategy.
E-Commerce: The $1.4M Inventory Fix
Before: Stock levels were visible but demand was unpredictable. Frequent stockouts of popular items. Overstock of slow movers tying up capital.
After BRIDGE: We focused on one decision—”optimize inventory to minimize stockouts while reducing excess by 20%”—then built predictive models incorporating seasonality, campaigns, and external factors like weather.
Result: Stockouts down 35%. Excess inventory down 22%. $1.4M in working capital freed. CFO became our biggest advocate.
Manufacturing: Ending the Dashboard Theater
Before: Beautiful real-time operations dashboard that couldn’t explain why production was delayed or what to do about it.
After BRIDGE: Shifted from descriptive (what happened) to diagnostic (why it happened) by integrating supply chain, maintenance, and workforce data with clear escalation protocols.
Result: Mean time to resolution for production issues dropped 43%. Dashboard usage jumped from 12% to 67% of operations staff.
The 15-Minute BI Failure Diagnostic
Take this assessment. If you score 6 or higher, you have a strategy problem, not a technology problem:
- [ ] Different departments report conflicting versions of the same metric
- [ ] Less than 30% of employees actively use your BI tools
- [ ] Dashboard requests backlog exceeds 90 days
- [ ] You can’t trace specific business decisions to analytics insights
- [ ] Teams maintain “shadow spreadsheets” because they don’t trust official dashboards
- [ ] Your data warehouse pulls from multiple systems with no master data management
- [ ] BI discussions focus on technical features, not business outcomes
- [ ] Leadership asks the same questions repeatedly that your dashboards should answer
- [ ] You’ve switched BI platforms in the last 3 years hoping new tools would fix adoption
- [ ] Nobody can clearly articulate what ROI you’re getting from analytics investments
Score 0-3: You’re ahead of most companies. Focus on optimization.
Score 4-7: Significant strategy gaps. You need intervention before your next tool purchase.
Score 8-10: Your BI investment is actively destroying value. Every day you wait costs more.
Why External Expertise Accelerates Everything
I know what you’re thinking: “Can’t our internal team fix this?”
Sometimes, yes. But here’s what 20+ years of consulting has taught me:
Speed: Building internal analytics strategy capability means recruiting, hiring, training senior talent across data architecture, governance, and change management. That’s 9-12 months minimum before you see results. External teams deliver immediately.
Objectivity: When the CFO’s favorite dashboard measures the wrong KPIs, nobody internal wants to say it. External consultants can have the conversations you can’t.
Pattern Recognition: Your team is solving this for the first time. We’ve solved it 47 times across healthcare, manufacturing, e-commerce, and SaaS. We know what works and what fails.
Cost Reality: Senior analytics talent commands $150K-200K salaries. Multiply that across the roles you need (data architect, BI developer, governance lead, change manager) and you’re approaching seven figures annually before benefits.
Strategic consulting engagements deliver enterprise expertise at a fraction of the cost—and transfer knowledge that persists after we leave.
The Choice Every Executive Faces
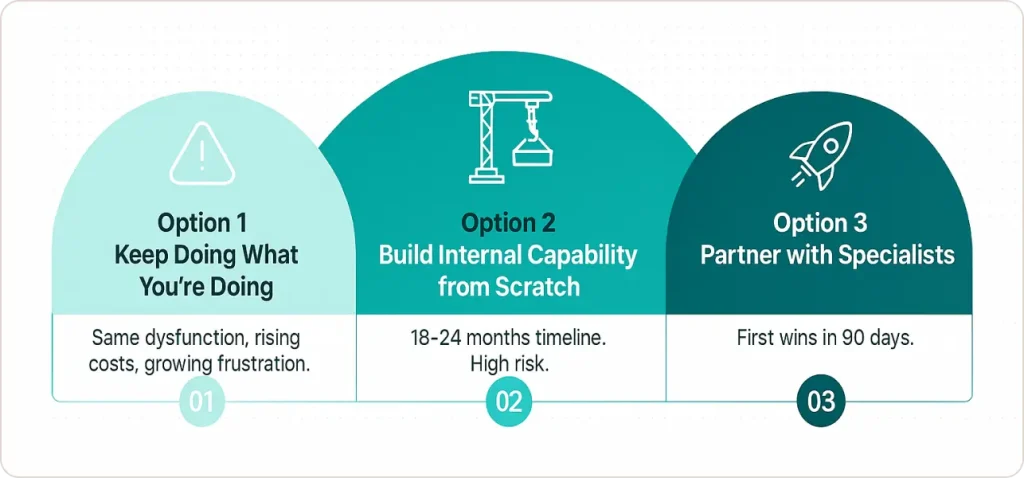
You have three options for fixing underperforming BI:
Option 1: Keep doing what you’re doing Result: Same dysfunction, growing costs, increasing frustration. Your competitors will eventually figure this out and leave you behind.
Option 2: Build internal capability from scratch Timeline: 18-24 months. Risk: High. You’ll make every expensive mistake we’ve already learned from. Some companies succeed. Most give up halfway through.
Option 3: Bring in specialists who’ve solved this 47 times Timeline: First wins in 90 days. Full transformation in 6-9 months. Knowledge transfer leaves you self-sufficient.
What Happens When You Choose Strategy First
At SR Analytics, we don’t just build dashboards. We implement data strategy solutions that create the foundation for BI success—the governance frameworks, organizational alignment, and culture transformation that turn data into decisions.
McKinsey Global Institute research demonstrates that data-driven organizations are 23 times more likely to acquire customers and 19 times more likely to be profitable. The gap between leaders and laggards isn’t technology—it’s strategic approach.
We position ourselves as an extension of your team, not outsiders with generic playbooks. We transfer knowledge, train your people, and build capabilities that persist long after our engagement ends.
The pattern we see repeatedly:
- Companies invest in tools expecting transformation
- They get dashboards but not decisions
- Adoption stalls, trust erodes, ROI disappears
- Data strategy consulting fixes what technology alone cannot
The tools are necessary. Strategy is sufficient.
Organizations seeking comprehensive transformation often benefit from integrating analytics capabilities with broader business intelligence initiatives. Companies that successfully align their data analytics services with strategic frameworks see faster implementation and higher adoption rates—ensuring that governance doesn’t remain theoretical but becomes embedded in daily decision-making workflows.