Data Visualization Consulting Services
Transform your complex data into powerful visual stories that drive strategic decisions with expert data visualization consulting services. SR Analytics delivers comprehensive data visualization services that turn overwhelming datasets into clear, actionable insights, helping organizations achieve 40% faster decision-making and measurable ROI within weeks.

Our Comprehensive Data Visualization Services
Results That Speak For Themselves
Don’t just take our word for it—hear from our customers.
Our Proven Data Visualization Consulting Services Process
Phase 1: Discovery & Goal Mapping
Phase 1: Discovery & Goal Mapping
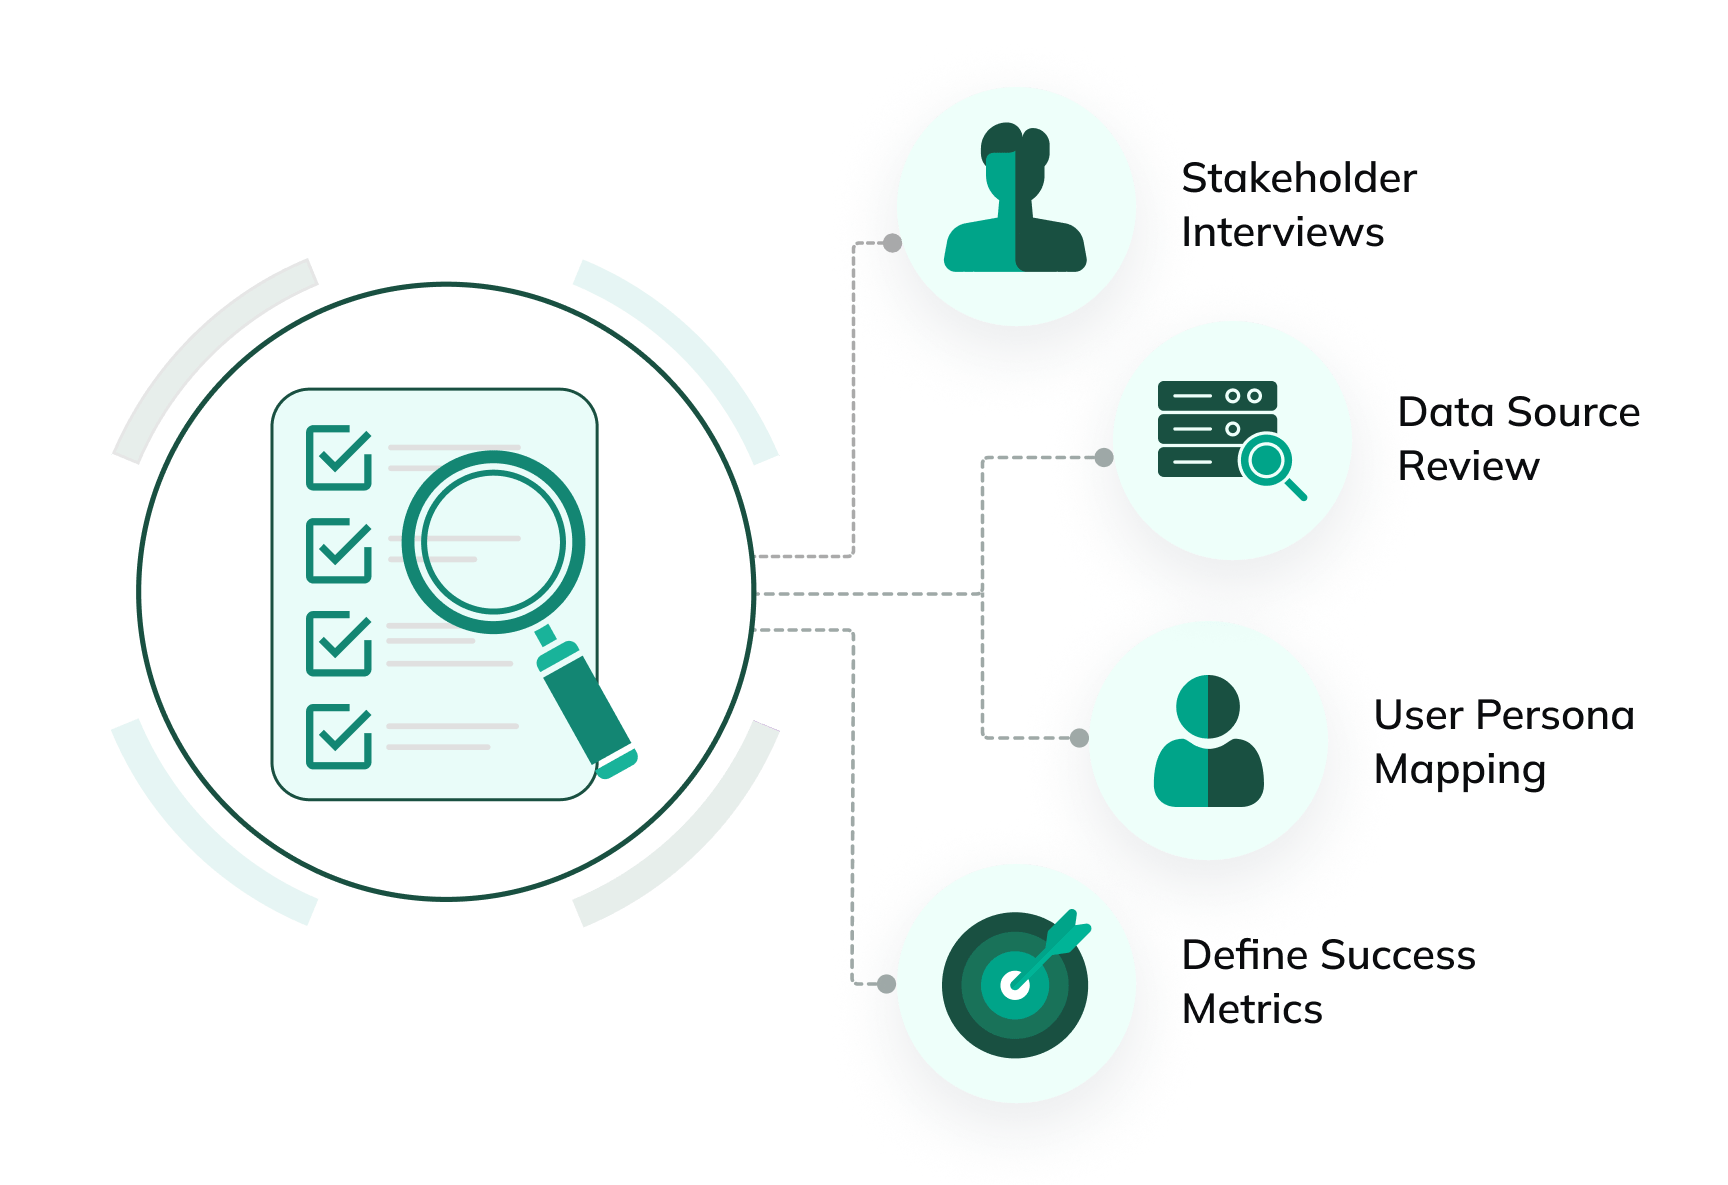
We begin every engagement with comprehensive stakeholder interviews and requirements gathering to understand your specific KPIs, user personas, and decision-making workflows through our Business Intelligence Consulting Services approach with expert data visualization consultant guidance.
- Comprehensive stakeholder interviews and requirements analysis
- Assessment of existing data sources and technical infrastructure
- User persona development and workflow mapping
- Clear success metrics and project milestone definition
- Organizational analytical maturity level evaluation
Phase 2: Data Assessment
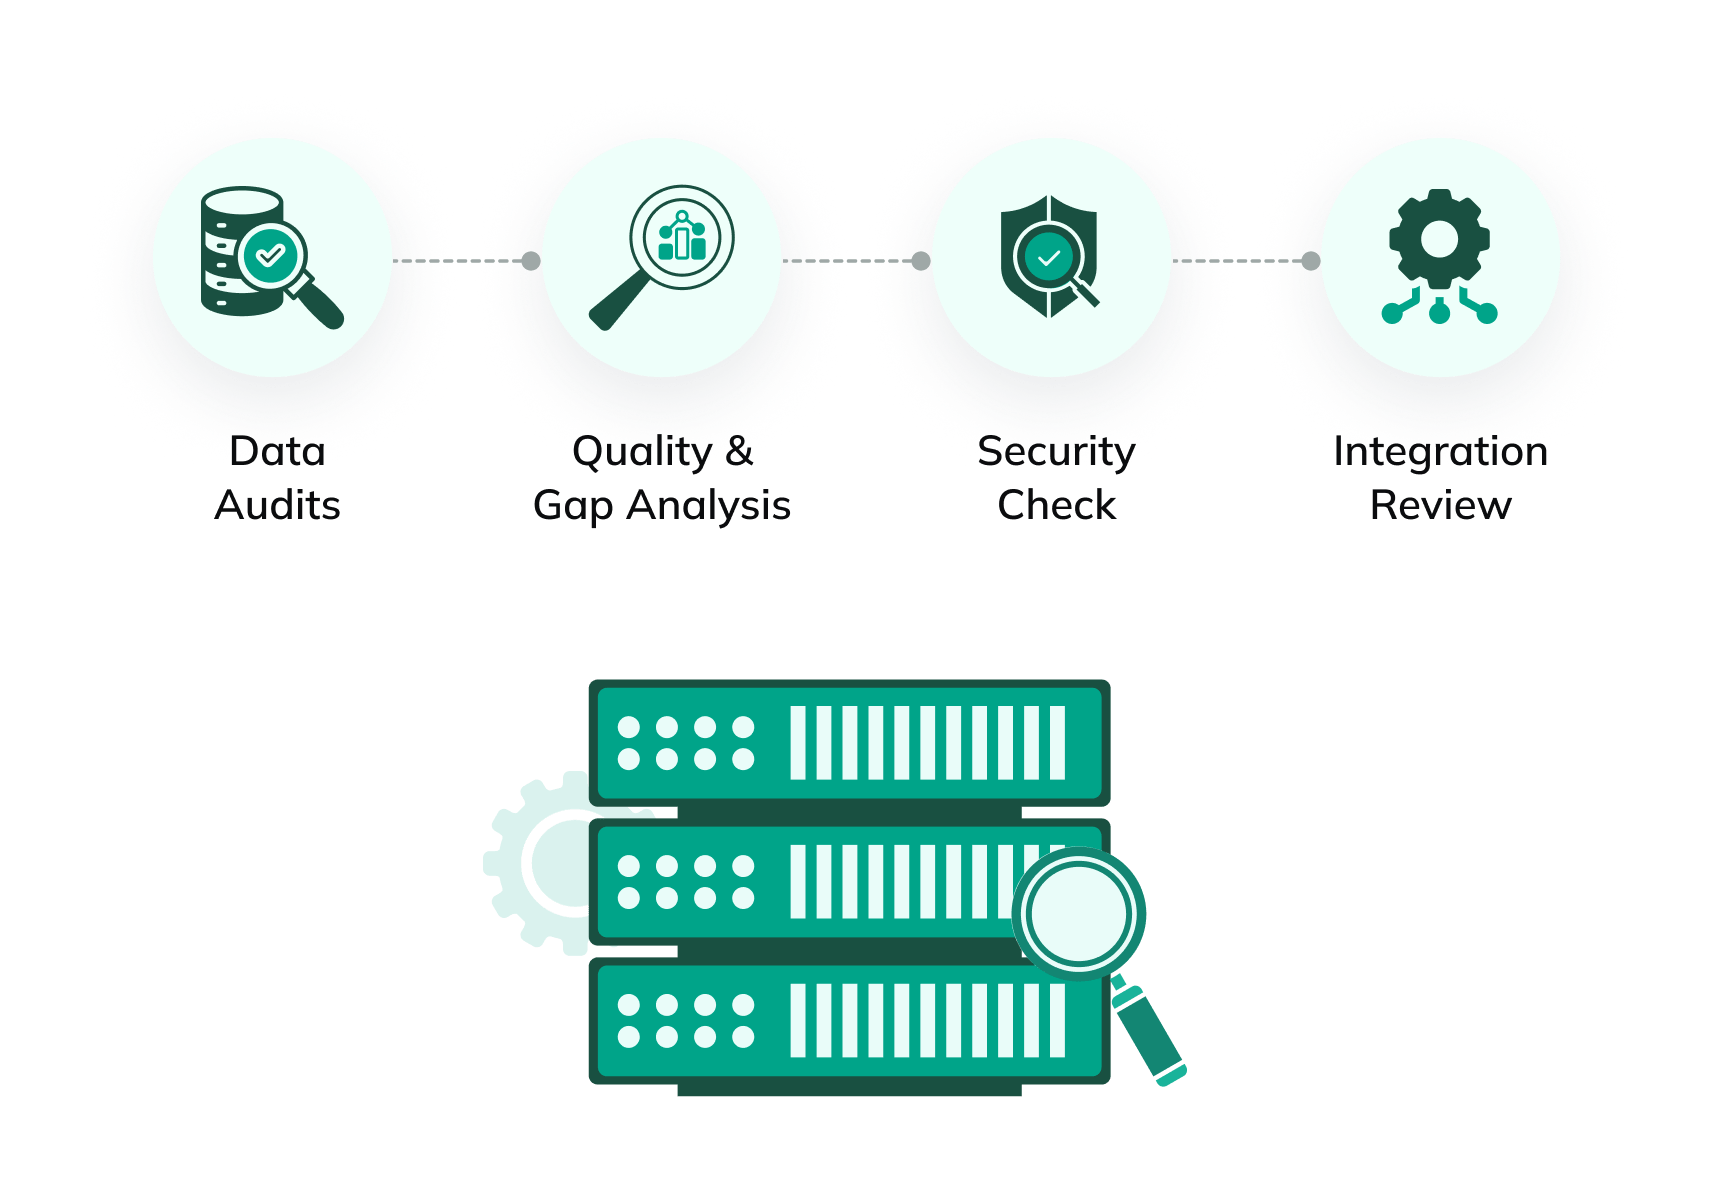
Our technical experts conduct thorough audits of your data landscape, evaluating source system reliability, data quality standards, integration complexity, and security requirements as experienced data visualization consulting services providers.
- Complete data source audits and quality assessments
- Integration complexity and security requirement evaluation
- Data gap identification and enhancement opportunities
- Detailed data dictionaries and mapping documentation
- Technical dependency assessment for accurate project scoping
Phase 2: Data Assessment
Phase 3: Wireframe & Design Mockups
Phase 3: Wireframe & Design Mockups
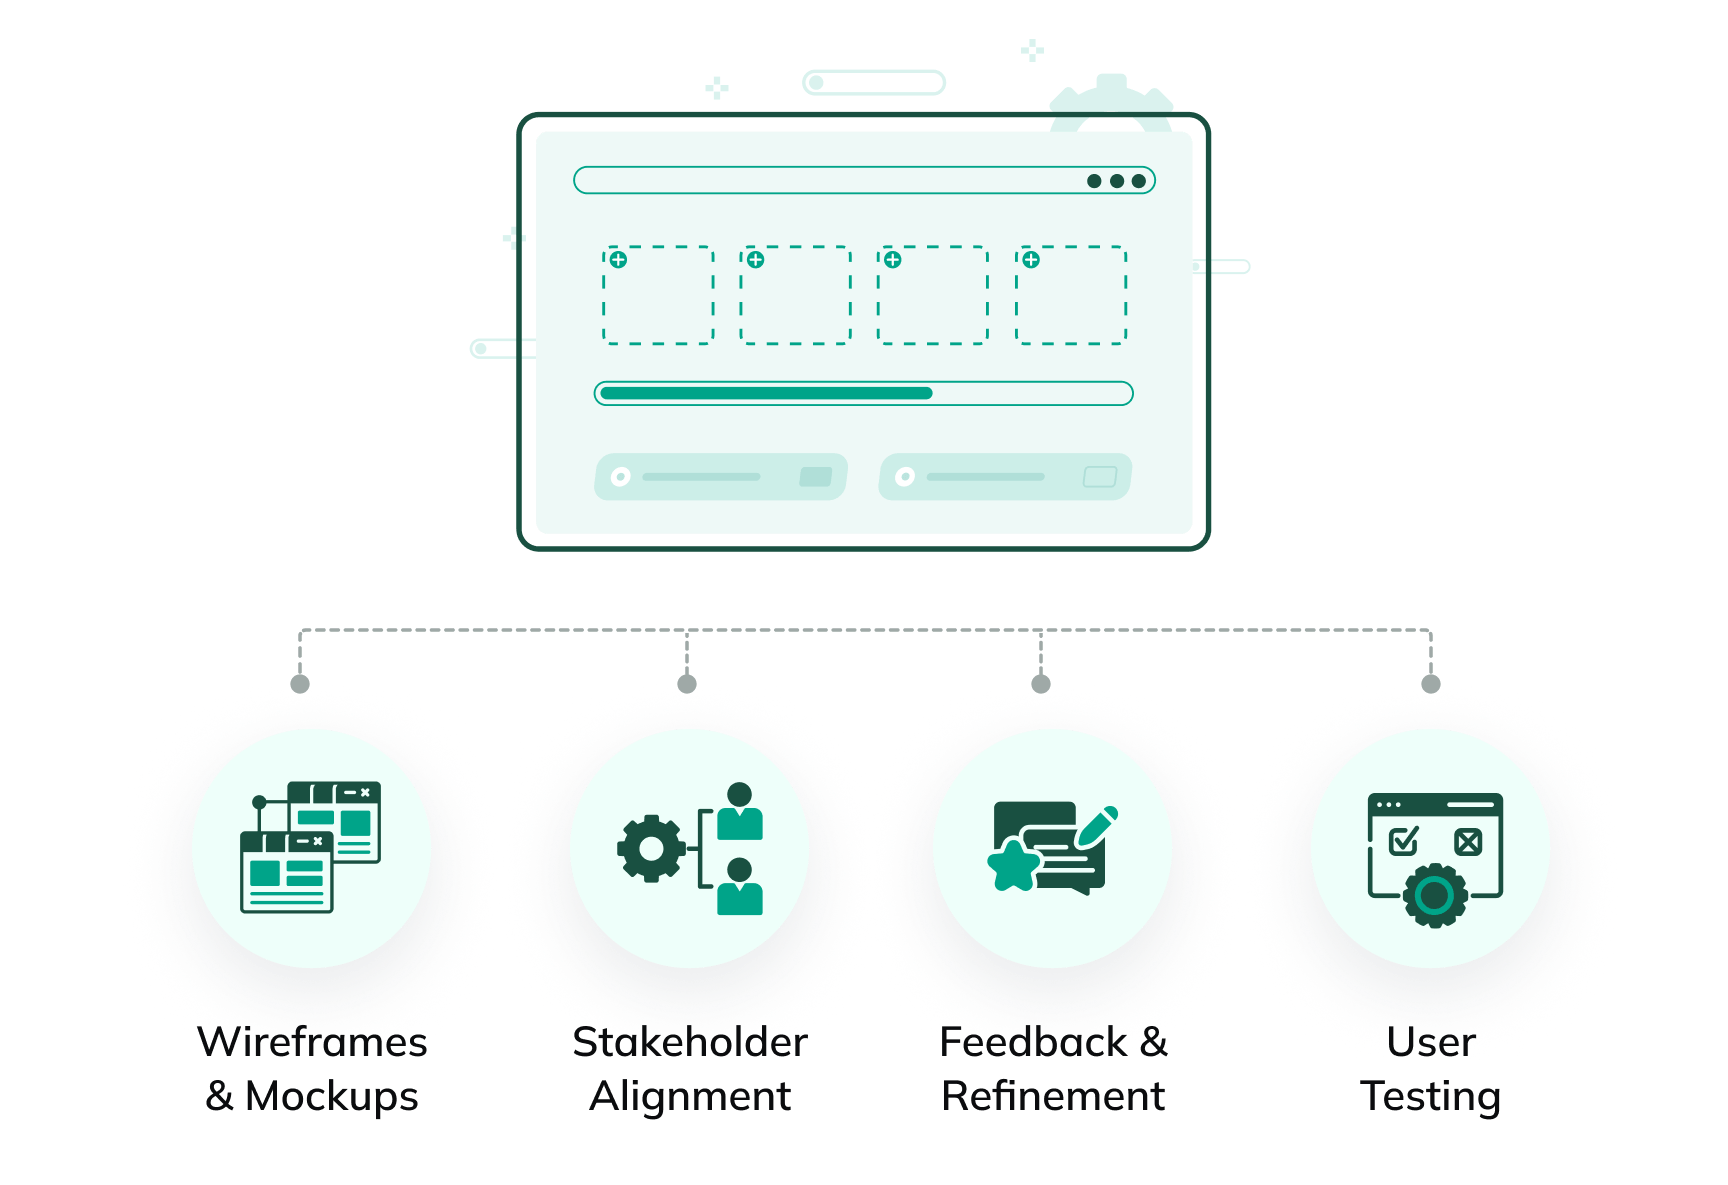
We create detailed wireframes and interactive mockups that align stakeholders on layout preferences, chart selections, and user experience flows before development begins through our data visualization services team.
- Detailed wireframes and interactive design mockups
- Stakeholder alignment on layouts and chart selections
- Iterative feedback sessions and design refinements
- User testing and stakeholder approval processes
- Interface optimization for specific workflows and preferences
Phase 4: Dashboard Development
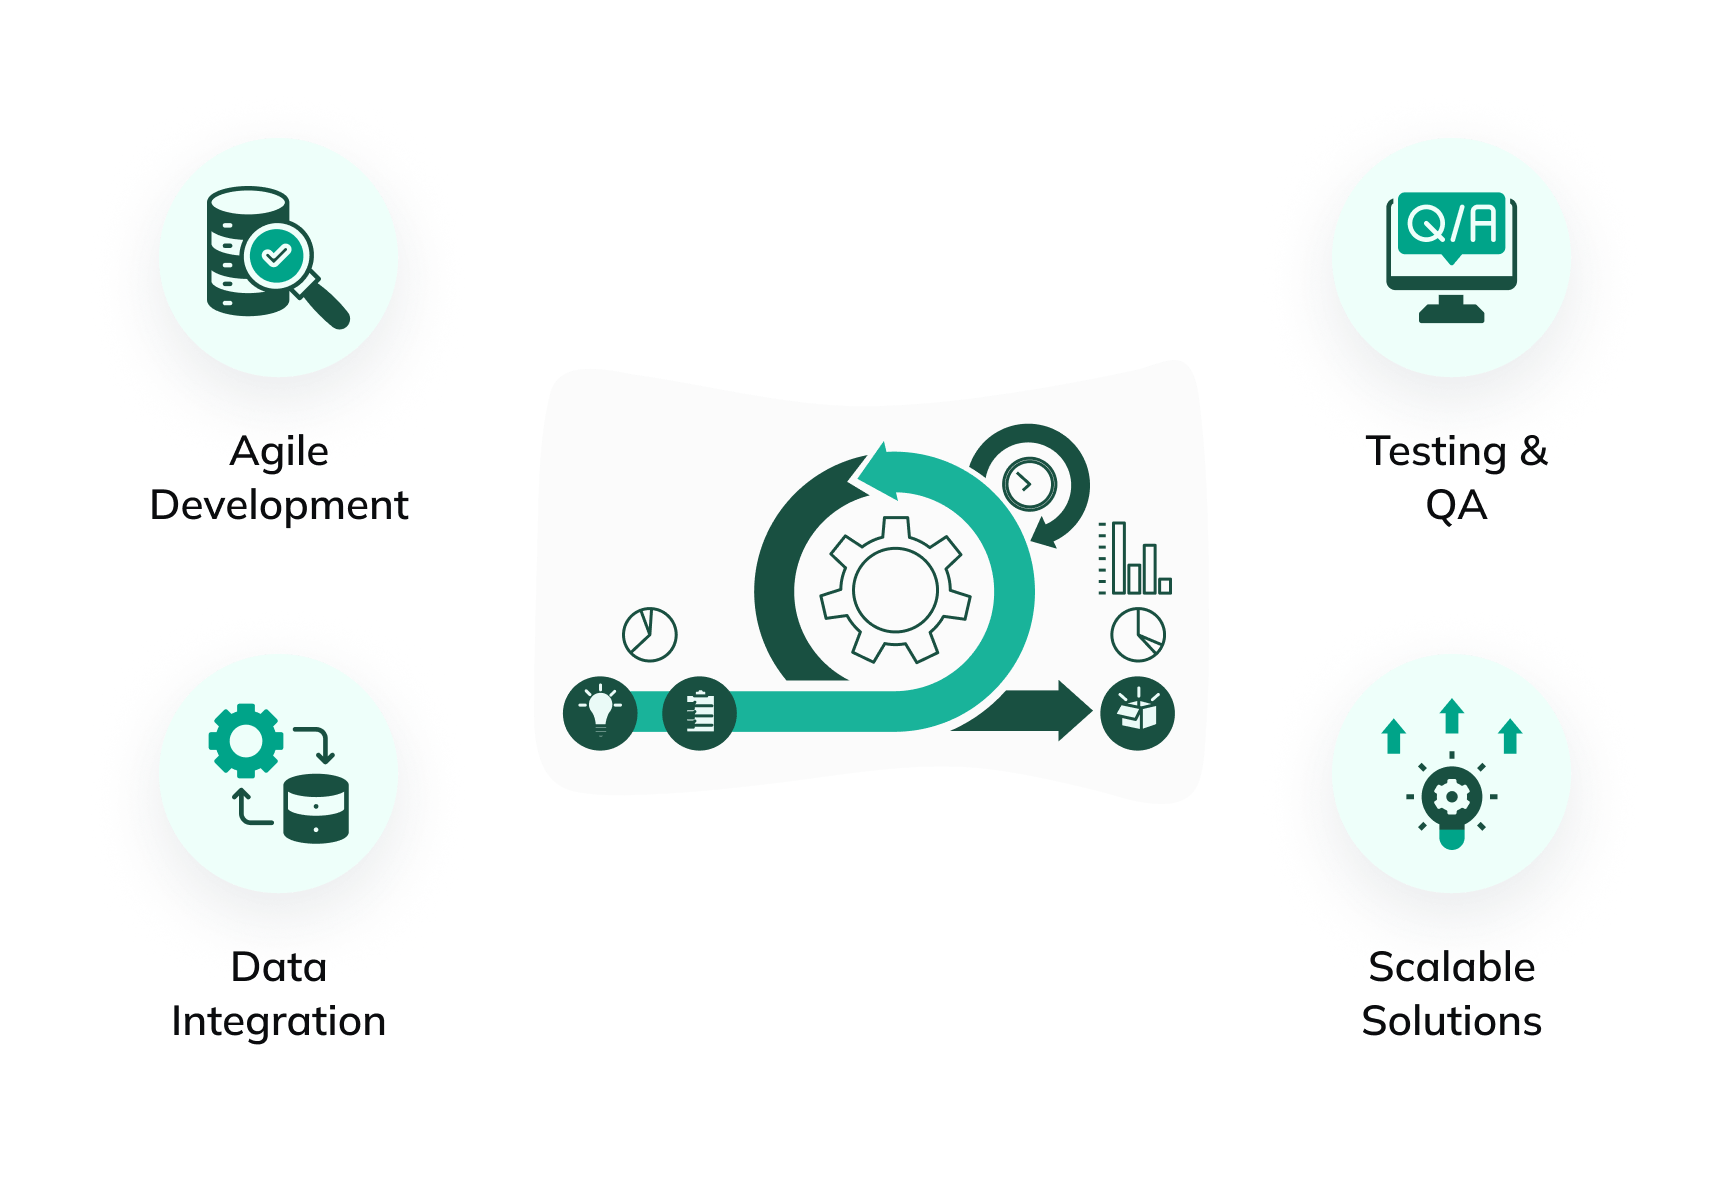
Our development team builds custom visualization solutions using agile methodologies that enable continuous feedback and refinement throughout the process from trusted data visualization service providers.
- Agile development with continuous feedback integration
- Robust data connections and automated refresh schedules
- Comprehensive testing protocols and quality assurance
- Security, performance optimization, and cross-platform compatibility
- Scalable solutions for future growth and evolving requirements
Phase 4: Dashboard Development
Phase 5: User Training & Handover
Phase 5: User Training & Handover
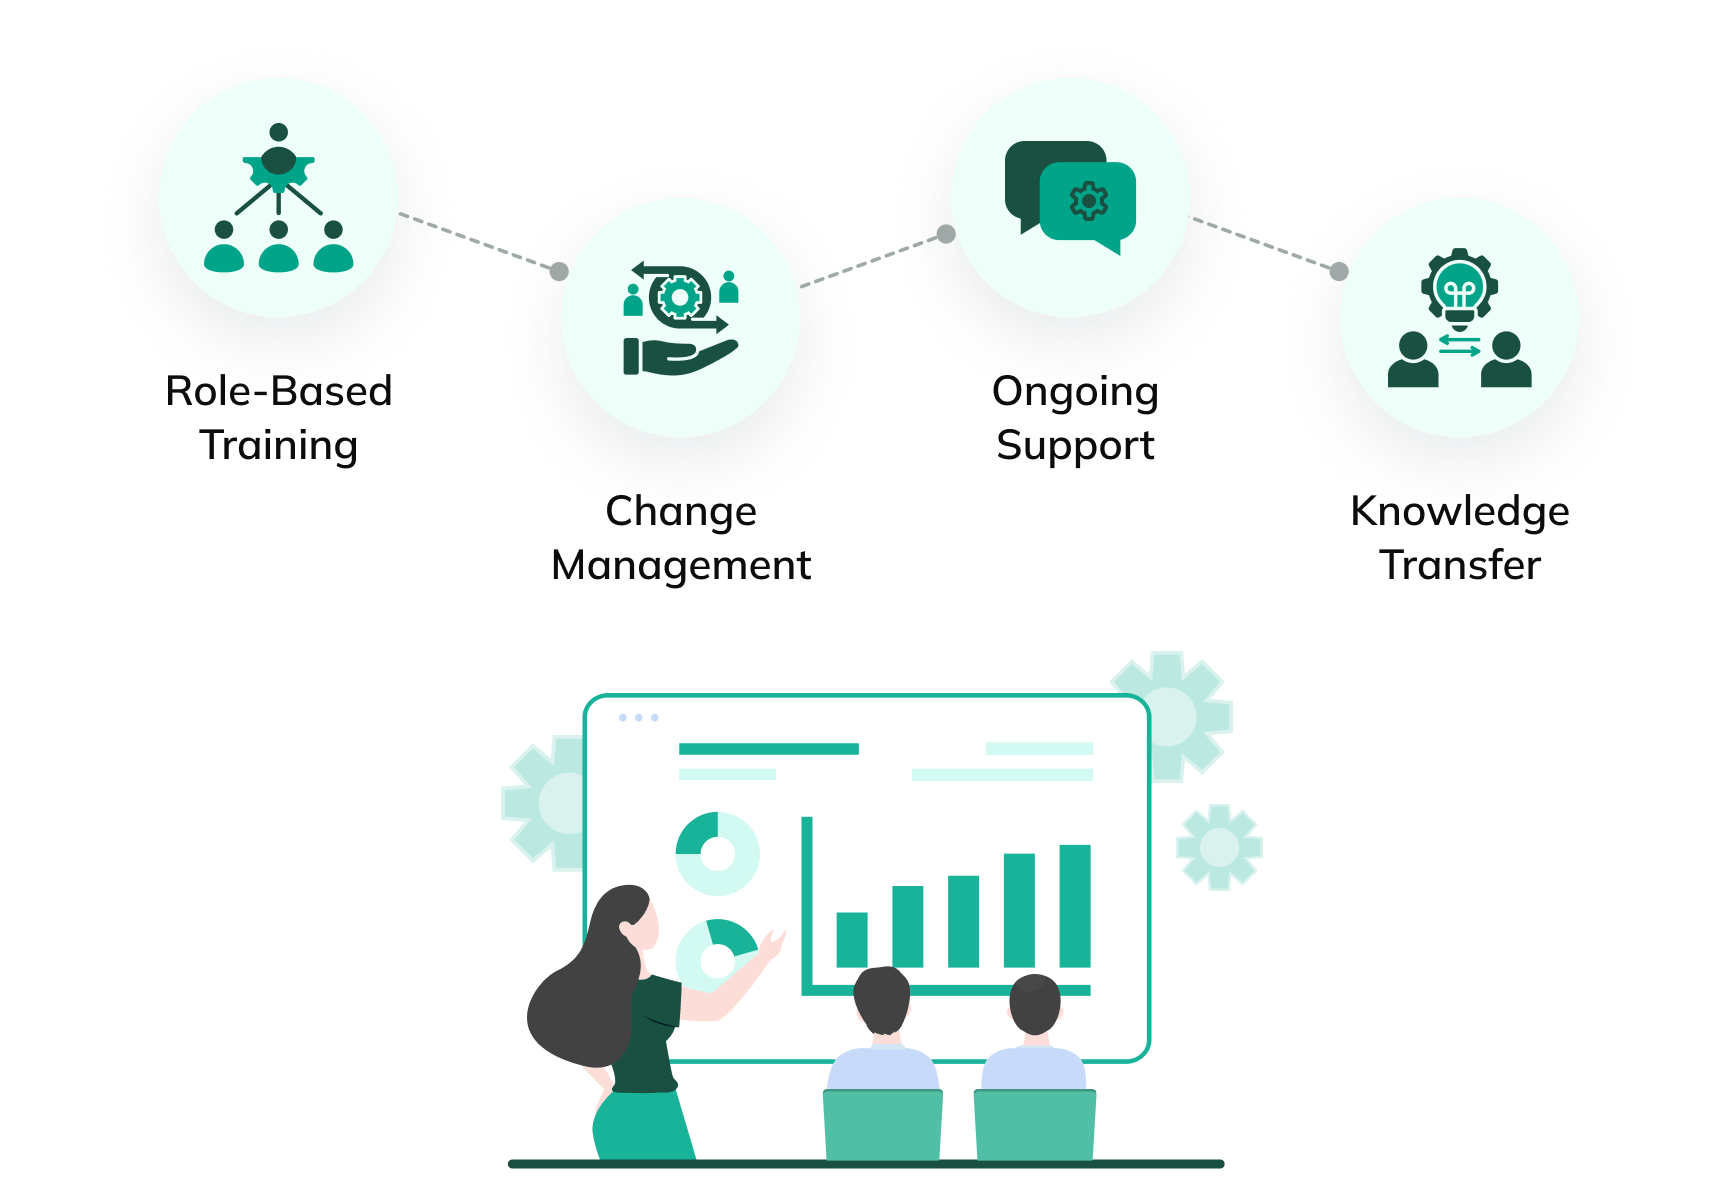
Success depends on user adoption and ongoing value realization through comprehensive training programs and support resources. Our data visualization solutions company includes change management approaches that build analytical literacy.
- Role-specific training sessions and user guide development
- Change management and analytical literacy building
- Ongoing optimization recommendations and support
- Knowledge transfer protocols for independent maintenance
- Continuous improvement and value delivery strategies
Success stories
Our Data Visualization Consulting Approach
Our proven 3-step data visualization consulting approach delivers impactful dashboards, aligned business insights, and faster decision-making with measurable results.
- Our data visualization consultants align business goals with industry best practices through in-depth analysis and stakeholder collaboration.
- We design custom dashboards and integrate your data sources to build intuitive, interactive visualizations tailored to your users.
- We offer ongoing support, training, and iterative improvements to ensure your dashboards evolve with your business needs.
Why Choose SR Analytics for Data Visualization Consulting Services?
Challenges We Solve with Data Visualization Services
Our Industries
Other Services
Data Visualization Services latest blogs
Frequently Asked Questions
Our Analytics Expert
Ready to elevate your business through the power of data?


