Key Highlights
- Organizations implementing well-structured BI initiatives see a 30% increase in operational efficiency (Gartner research)
- 78% of organizations now use AI in at least one business function, up from 55% in 2023 (McKinsey State of AI, 2025)
- Data-driven organizations are 23 times more likely to outperform competitors in customer acquisition (McKinsey research)
- By 2028, at least 15% of day-to-day work decisions will be made autonomously through agentic AI (Gartner predictions)
- BI market expected to reach $63.20 billion by 2032, with 8.9% CAGR (Industry Analysis)
Ever watched a company consistently make great decisions while its competitors seem to flounder? Nine times out of ten, it comes down to how they use their data. A solid business intelligence strategy isn’t just nice to have anymore—it’s essential.
The $2.4 Million Mistake I See Every Week
Last month, a SaaS CEO showed me his “comprehensive” BI dashboard. Forty-three widgets. Real-time data feeds. Color-coded everything.
“Beautiful,” I said. “What decision did you make with it yesterday?”
Silence.
He’d spent eight months and $240K building a data mansion that nobody lived in. Sound familiar?
Here’s the uncomfortable truth: 73% of business intelligence initiatives fail to deliver measurable ROI (Gartner, 2024). Not because the technology is bad, but because most companies approach BI completely backwards.
Quick Answer
A comprehensive business intelligence strategy transforms raw data into a competitive advantage through structured planning, advanced analytics, and AI-driven insights. Organizations implementing effective BI strategies report 30% higher operational efficiency and 5x faster decision-making, enabling data-driven growth and strategic agility in competitive markets.
What Exactly Is a Business Intelligence Strategy?
A business intelligence strategy is essentially your comprehensive roadmap for turning data chaos into clarity. It maps out how your organization will collect, analyze, and use data to make better decisions through strategic implementation.
Think of your BI strategy roadmap as the GPS for your data journey. Without it, you’re just collecting information without purpose—like hoarding ingredients with no recipe in mind.
Here’s what a comprehensive BI strategy answers:
- Vision: What do you want to achieve by implementing the BI solution?
- Which business problems are we trying to solve with data?
- What information do we need, and where will we get it?
- How will we transform raw data into insights?
- Who and how: Who will be responsible for running the strategy?
- Will it be an internal resource or an external one?
- Who needs access to which information?
- Tools and business operations: Which software platform do you want to use, and which departments do you want to start with?
- How will we measure success?
The Backwards Approach That Changes Everything
Traditional BI thinking goes: Collect all the data → Build dashboards → Hope people use them
The approach that actually works: Identify key decisions → Determine required insights → Build minimal viable analytics
Let me show you the difference with a real example.
Case Study: How a $50M Retail Chain Cut Decision Time by 85%
The Old Way:
- 12 different reports from 8 systems
- Weekly meetings to “review the numbers”
- Decisions took 2-3 weeks minimum
- Conflicting data sources led to endless debates
The New Way (Decision-First Approach):
- Identified 3 critical decisions: Store expansion, inventory allocation, promotional timing
- Built focused dashboards for each decision type
- Automated data collection for only the metrics that mattered
- Results: Decisions now take 2-3 days, 40% improvement in store performance
The key difference? They started with the decision, not the data.
Why Your Business Desperately Needs a BI Strategy
Let’s be honest: Without a clear business intelligence strategy, you’re essentially flying blind. I’ve seen too many companies invest in fancy BI tools without a plan, resulting in expensive dashboards nobody uses.
The global BI market itself has a compounded annual growth rate (CAGR) of 8.9% and is forecasted to reach USD 63.20 billion by 2032. This exponential growth isn’t baseless.
The perils of not analyzing data are agonizing and far-reaching. Some include falling behind in competition, being unaware of customers’ requirements, missing out on strategic growth opportunities, and more.
When done right, effective BI strategies deliver concrete benefits:
- Better Decisions, Faster: Replace those endless debates and gut feelings with fact-based decisions. One manufacturing client cut their decision-making time from weeks to days by implementing clear data visualization protocols through their reporting strategy.
- Single Source of Truth: No more meetings where different departments bring conflicting numbers. A healthcare organization I worked with eliminated cross-department data disputes by establishing centralized definitions for patient metrics as part of their comprehensive BI approach.
- Competitive Edge: Spot market trends before your competitors do. A boutique fashion retailer detected a shift in customer preferences three months before their competitors by analyzing social engagement alongside sales data through their software strategy.
- Operational Efficiency: Find and fix bottlenecks you didn’t even know existed. One financial services firm discovered they were spending 40% of their resources on a product line generating only 15% of revenue.
- Cost Reduction: Target inefficiencies with surgical precision. A distribution company identified $2.3M in annual savings by analyzing delivery routes and warehouse operations through their new BI system.
This podcast explores how modern Business Intelligence (BI) tools empower businesses to make data-driven decisions, enhancing operational efficiency and strategic planning. It highlights the evolution of BI technology, including AI integration, and its critical role in driving competitive advantage and organizational performance.
The 4-Decision Framework That Actually Works
Before you touch any BI tool, answer these four questions:
1. What Decision Keeps You Awake at Night?
Not “what data do we have,” but “what choice would transform our business if we got it right?”
Examples:
- Should we expand to the West Coast? (Geographic expansion)
- Which customers are about to churn? (Retention strategy)
- What’s our optimal pricing strategy? (Revenue optimization)
2. What Would You Need to Know to Make This Decision Confidently?
Break down the insights required:
- Market size and competition data
- Customer behavior patterns
- Financial projections and risk factors
3. What’s the Minimum Data Required for 80% Confidence?
Resist the urge to collect everything. Focus on:
- Data that directly impacts the decision
- Metrics you can actually influence
- Information available within your timeframe
4. How Will You Know If You Made the Right Choice?
Define success metrics upfront:
- Measurable outcomes
- Realistic timelines
- Clear attribution methods
“The power of AI, and the increasing importance of GenAI are changing the way people work, teams collaborate, and processes operate. Organizations that fail to make the transition and effectively leverage data and AI will not be successful.” — Ramke Ramakrishnan, VP Analyst at Gartner (Source)
Building Your Business Intelligence Strategy: The Complete 8-Step Framework
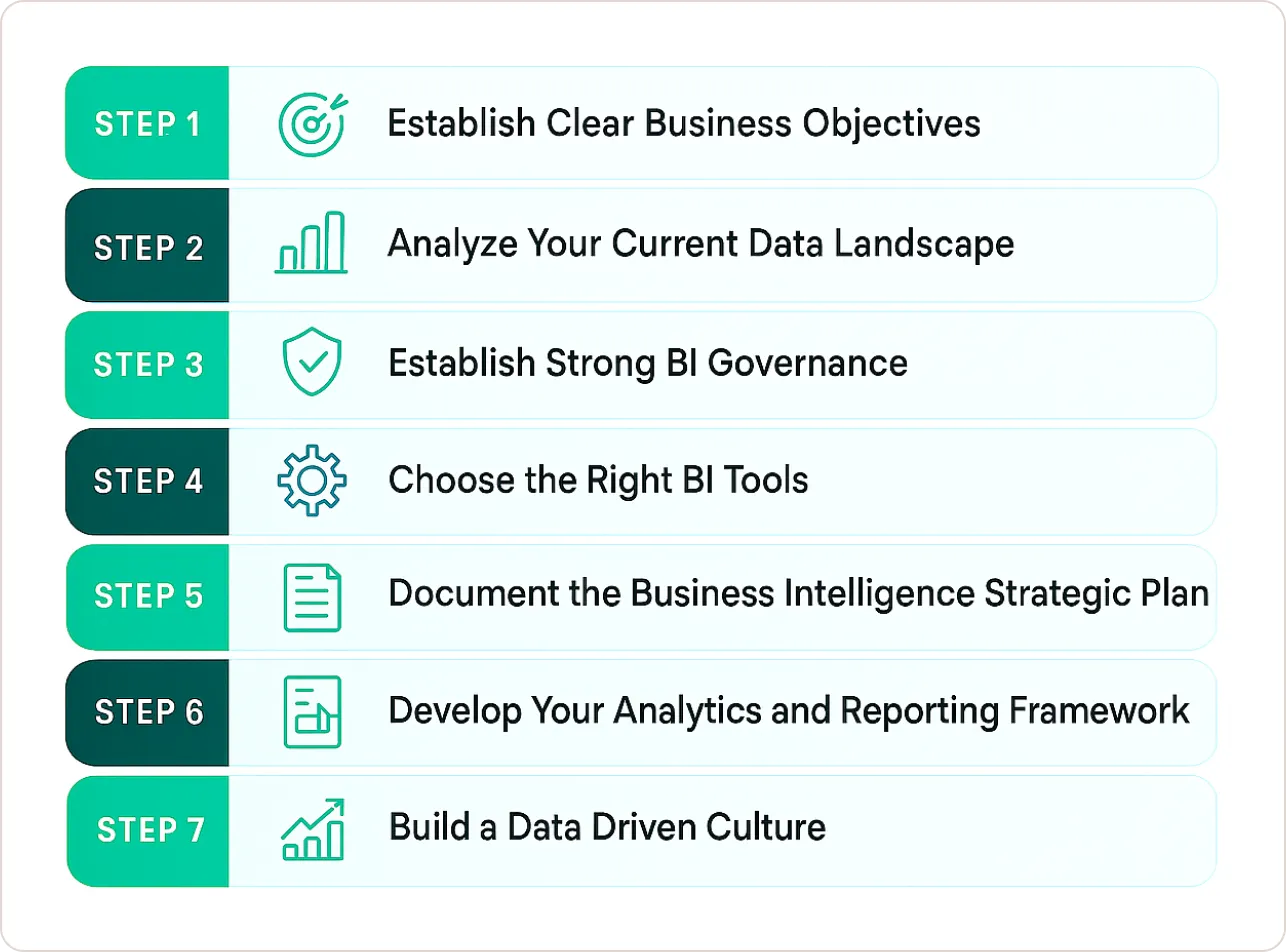
Step 1: Establish Clear Business Objectives with Vision
The biggest mistake I see? Companies starting with the data they have rather than the problems they need to solve.
Having a vision—which means a direction with purpose—is the first step of any successful BI strategy. It should be done with an open mind. Ask yourself why you want to implement BI in your organization and what are your expectations.
Your strategy must align with specific business goals. Are you trying to increase customer retention? Streamline operations? Enter new markets? Different objectives require different data and tools.
Take a fintech startup I advised. Their initial goal was “better reporting,” but when we dug deeper, what they really needed was to understand why their customer acquisition cost had doubled in six months. This clarity completely changed their approach.
The BI strategy needs to be embedded within your business operations and in line with your objectives.
For each business objective, create SMART goals (Specific, Measurable, Achievable, Relevant, Time-bound):
Instead of: “Improve our understanding of customers” Try: “Reduce customer churn by 15% within six months by identifying at-risk segments and behavior patterns”
This specificity will guide everything from data collection to dashboard design in your reporting strategy.
Step 2: Analyze Your Current Data Landscape
Before building anything new, take stock of what you already have. To design a precise roadmap, you need to know where your business currently stands with respect to business intelligence.
This inventory should include:
Data sources: What systems currently capture data? (CRM, ERP, marketing platforms, etc.)
- Do you currently use data for any of your decision-making processes?
- Are there any dashboards in place?
Data quality: How clean, complete, and consistent is your data?
Existing reports: What analytics do teams already use?
Skills and resources: What capabilities exist within your organization?
- How equipped is your IT team to develop a data center?
- Are you using any database solutions or any tools? If yes, then what are they?
- Do you use any paid BI tools? How do you manage data currently, and is there any data analytics team in place?
One retail client discovered they had customer purchase data spanning five years that nobody was analyzing because it lived in an old system everyone had forgotten about. This historical goldmine completely changed their understanding of seasonal buying patterns.
Be brutally honest in this assessment. If your CRM data is a mess because sales reps only fill out required fields, acknowledge this limitation now before building dashboards on shaky foundations.
For a detailed analysis of common data challenges, read our guide on data analytics challenges and solutions.
Step 3: Establish Strong BI Governance
BI governance primarily consists of BI teams, tools, support, and KPIs. Once you know where you are, you need to work on the team, tools, support, and KPIs to achieve your vision.
Your governance framework should address:
They identify data requirements, create data governance structures, and look over the data quality and data incorporation processes.
- Data ownership: Who’s responsible for different data domains?
- Data quality: How will you ensure accuracy and completeness?
- Metadata management: How will you document what different metrics mean?
- Access controls: Who can see and modify different data types?
- Compliance: How will you address regulatory requirements?
Support It is something new that you are implementing, so you may face mental blocks from your employees. Make sure to develop a data culture through training, open-house discussions, and support.
Select a mentor in each department who can guide others in data points and the use of BI tools. Even end-users need training, or else they will fail to derive meaningful insights.
Key Performance Indicators (KPIs) Since KPIs are the most crucial aspect of growth, identifying them correctly is essential. KPIs highlight the areas in which the business is on the right track and the ones that need improvements.
A healthcare client learned this lesson the hard way when different departments used different definitions of “patient visit,” leading to completely irreconcilable reports. Their solution: a data dictionary that standardized definitions across the organization and clear ownership for each metric.
Remember the saying “garbage in, garbage out”? It’s never been more relevant than with business intelligence.
Step 4: Design Your Data Architecture
Your architecture determines how data flows through your organization. Think of it as the plumbing system for your insights.
Key considerations include:
- Data storage: Will you use a data warehouse, data lake, or both?
- Integration approach: How will you connect disparate systems?
- Processing needs: Batch vs. real-time data requirements
- Scalability: How will the system grow as your data volume increases?
For smaller businesses, starting simple is perfectly fine. One successful restaurant group built their initial BI strategy using Google Sheets connected to their POS system before graduating to more sophisticated tools as they expanded.
Remember that perfect is the enemy of good. Begin with an architecture that solves your most pressing needs, then evolve as your capabilities mature.
Step 5: Choose the Right BI Tools
With countless options available, selecting the right business intelligence tools can feel overwhelming. If you are just starting, it’s best to use tools like Power BI or Tableau. These drag-and-drop BI tools are easy to use, can collect data from different sources, and understand natural language.
But make sure that your data sources are authentic and of high quality. Build a data warehouse for storing all the data.
Focus on:
- User needs: Who will be using these tools and for what purpose?
- Technical requirements: What data sources need to be connected?
- Scalability: Will the solution grow with your business?
- Total cost of ownership: Beyond licensing, consider implementation and maintenance
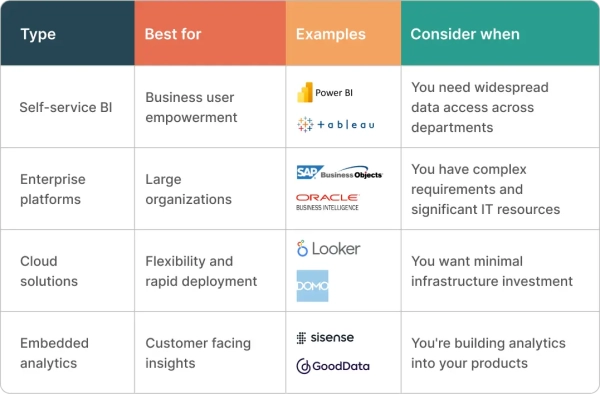
Here’s a simplified breakdown of popular options:
| Tool | Best For | Pricing Range | Key Strengths |
|---|---|---|---|
| Power BI | Microsoft ecosystem | $10-20/user/month | Integration, cost-effective |
| Tableau | Advanced visualization | $70-150/user/month | Visualization capabilities |
| Qlik Sense | Self-service analytics | $30-50/user/month | Associative model |
Don’t just evaluate features—test how tools handle your actual data and use cases. A manufacturing client chose Power BI over a more expensive competitor after discovering it handled their complex production metrics more intuitively for their team.
For detailed tool comparisons, read our guide on Power BI vs Tableau for small businesses and explore our comprehensive top BI tools guide for 2025.
Step 6: Document the Business Intelligence Strategic Plan
You need to document your business intelligence strategy as a point of reference for the entire organization. So, what should it include?
BI Strategy’s Alignment with Your Business Plan Elaborate BI’s value addition, how it will help solve current problems, and how it will benefit the employees performing their roles – state out every point.
Scope and Requirements Here you should lay down the following steps:
- Required budget and staff
- The tools and enterprise you are planning to use
- Will you hire in-house or work with a BI consultant
BICC Structure Introduces the team members who will lead the project. A clear structure helps everyone know who to reach out to for any data-related query. Furthermore, it reduces confusion.
Other Options Evaluated When stakeholders know the other options evaluated by you and why you didn’t consider them, it clears doubts. Thus, builds confidence in your decision.
State Roles Stakeholders who are not part of the BI team will also have a role to play. Some might be the end-users, while others might be your data source. In whichever scenario, everyone should know what’s expected from them and why.
Point of Reference Prepare a document for reference, like guidelines for using the tool, and the meaning of different data terms. And any other details you have not already mentioned in the roadmap document.
Step 7: Develop Your Analytics and Reporting Framework
Now comes the exciting part—deciding how insights will be delivered to users. Your framework should outline:
- Key metrics: What specific measurements matter to different roles?
- Reporting hierarchy: From executive dashboards to detailed operational reports
- Refresh frequency: Real-time, daily, weekly, or monthly updates?
- Visualization standards: How will complex data be presented clearly?
The best business intelligence reporting tools balance depth with clarity. I’ve seen too many dashboards crammed with every possible metric, overwhelming users into analysis paralysis.
Instead, follow the principle of progressive disclosure: start with high-level insights, then allow users to drill down as needed. A financial services client dramatically increased dashboard adoption by redesigning reports to show just five key metrics on the main screen with optional deep-dives available on demand.
To overcome common implementation challenges, review our guide on business intelligence challenges and solutions.
Step 8: Build a Data-Driven Culture
The most sophisticated BI strategy will fail without user adoption. Technical implementation is only half the battle—creating a data-driven culture is equally important.
Successful approaches include:
- Executive sponsorship: Leadership must visibly use data in their own decision-making
- Training programs: Invest in building data literacy across the organization
- Success stories: Celebrate wins where data insights drove business results
- Feedback loops: Continuously improve based on user experience
A retail banking client created “data champions” within each department who received advanced training and became internal advocates. These champions addressed skepticism from colleagues and provided day-to-day support better than any external consultant could.
For comprehensive guidance on building analytics capabilities, explore our client success stories to see real-world implementations.
The 3-Phase Implementation That Prevents Failure
Phase 1: Decision Audit (Week 1-2)
Goal: Identify your top 5 business-critical decisions
Process:
- Interview C-level executives and department heads
- Map decisions to business impact and frequency
- Rank by potential ROI and feasibility
- Select 1-2 decisions for pilot project
Deliverable: Decision Priority Matrix
Phase 2: Minimum Viable Analytics (Weeks 3-6)
Goal: Build the simplest possible solution that enables better decisions
Process:
- Identify essential data sources (usually 2-3 systems)
- Create basic dashboards focusing on actionable metrics
- Establish data refresh schedules based on decision timing
- Test with actual decision-makers
Deliverable: Working prototype that influences real decisions
Phase 3: Scale What Works (Months 2-6)
Goal: Expand successful patterns to additional decisions
Process:
- Measure impact of pilot decisions
- Document what worked and what didn’t
- Apply learnings to next priority decisions
- Gradually build comprehensive BI infrastructure
Success Metric: Each phase should show measurable business impact
The Data Culture Myth (And What Actually Works)
Everyone talks about building a “data-driven culture.” Here’s why that’s backwards and what you should do instead:
The Myth: “If we build it, they will come”
Reality: People don’t resist data; they resist change and complexity.
What Actually Works: Decision-Driven Culture
Instead of pushing data literacy training, focus on:
- Make heroes of good decision-makers (not data analysts)
- Celebrate decision outcomes (not dashboard usage)
- Share stories of avoided mistakes (not just wins)
- Measure decision quality (not data consumption)
Real Example: How a Legal Firm Transformed Decision-Making
Challenge: Partners made client acquisition decisions based on intuition Solution: Simple dashboard showing client lifetime value by source Cultural Change: Partners started asking “What does the data say?” before taking new clients Result: 34% increase in profitable client relationships
The key: They positioned data as a decision-making tool, not a reporting requirement.
Common Failure Patterns (And How to Avoid Them)
Pattern 1: Dashboard Graveyard
Symptoms: Dozens of unused reports, low user adoption Root Cause: Built dashboards before understanding decisions Fix: Start with decision audit, build only what’s needed
Pattern 2: Analysis Paralysis
Symptoms: Endless data requests, no actual decisions made Root Cause: Perfectionism over action Fix: Set decision deadlines, work with available data
Pattern 3: Tool Hopping
Symptoms: Multiple BI platforms, frustrated users Root Cause: Focusing on features instead of outcomes Fix: Choose tools based on user needs and decisions
Pattern 4: Data Silos
Symptoms: Conflicting reports, interdepartmental disputes Root Cause: No single source of truth Fix: Establish data governance early, document definitions
Conclusion: Transform Your Business with Strategic Intelligence
In today’s world, staying aloof from digital transformation is not possible. So, better drive a business intelligence strategy that will give you a firm competitive ground. As the saying goes, “By failing to prepare, you are preparing to fail.” Do not take the business intelligence strategy and roadmap casually. It is indeed the first step towards longer success. Go about it carefully and pay utmost care to each step.
The most expensive BI projects I’ve seen had perfect data architecture and unused dashboards. The most successful started with a simple question: “What decision would change everything?”
Your BI strategy isn’t about collecting data—it’s about making better choices faster than your competition.
Next step: Pick one decision that’s keeping you up at night. Spend 30 minutes figuring out what data would help you make it confidently. Then go get that data, however imperfectly.
Everything else is just decoration.