Key Highlights
- Master essential ecommerce metrics to track conversion rates, customer lifetime value, and cart abandonment
- Implement integrated analytics foundation by connecting marketing, sales, and fulfillment data through unified dashboards
- Leverage customer segmentation strategies using behavioral data for targeted campaigns that boost repeat purchases
- Optimize marketing attribution by allocating budget based on channels that drive highest ROI
- Build predictive analytics capabilities using AI insights for demand forecasting and inventory optimization
- Overcome common data challenges by breaking down silos, ensuring privacy compliance, and avoiding analysis paralysis
🚀 Ready to turn every website visitor into valuable business intelligence?
Picture this: you’re running your online store, but only a fraction of visitors actually buy. What is ecommerce analytics? It’s your systematic approach to collecting and interpreting data using ecommerce analytics tools to boost sales and optimize customer experience.
Ecommerce businesses completely transform their performance once they master ecommerce performance analytics. With 16% of managers still making decisions based on guesswork, the businesses that embrace data-driven strategies are leaving their competition behind.
In this guide, I’ll walk you through essential key metrics to track across your customer journey and the best ecommerce analytics tools and ecommerce reporting tools that will transform your data through comprehensive ecommerce analytics dashboard solutions.
AI Overview
Ecommerce analytics is the systematic collection and analysis of online store data to optimize performance and drive revenue growth. It tracks key metrics like conversion rates, customer lifetime value, and marketing attribution across the customer journey.
Why eCommerce Analytics Matters – The Game-Changing Benefits
Running your ecommerce business without analytics is like driving blindfolded. I can’t stress this enough – data insights provide the vision you need to navigate today’s competitive landscape and make smart decisions that directly impact your bottom line.
Data-Driven Decisions Drive Superior Results
Here’s what I’ve observed: companies that embrace online retail metrics see significantly better growth compared to those relying on intuition alone. When you start collecting data from your online store and analyzing it systematically, you’ll be able to:
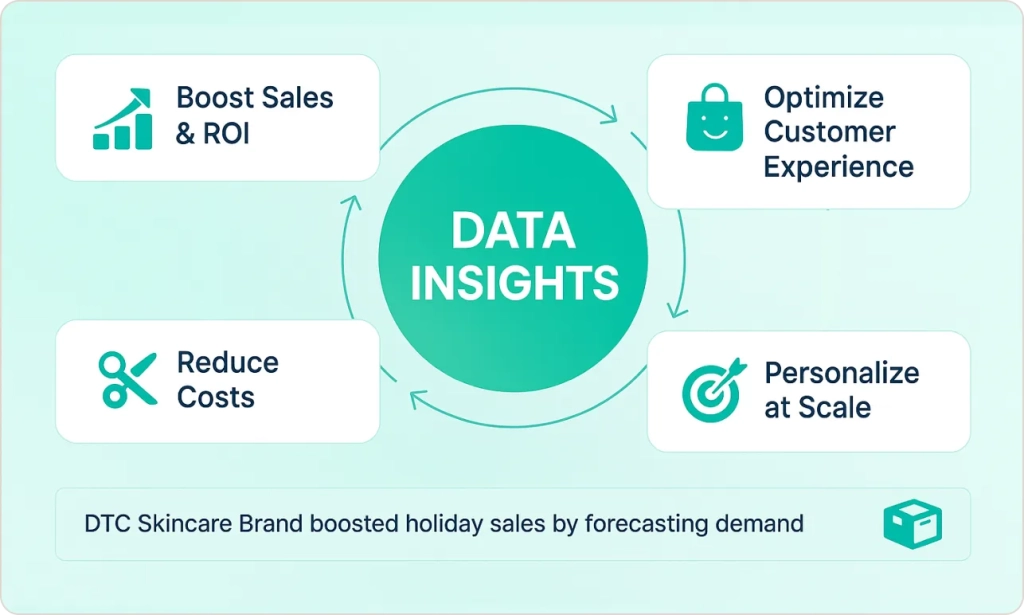
- Boost your sales and ROI: You’ll identify which products, marketing campaigns, and customer segments generate the highest returns through your analytics dashboard
- Optimize your customer experience: You’ll understand user behavior patterns across the customer journey to reduce friction and increase satisfaction
- Reduce your costs: You’ll eliminate wasteful spending on underperforming marketing channels and inventory through targeted analytics
- Personalize at scale: You’ll use data to deliver relevant product recommendations and targeted offers that your customers actually want
Let me share a real example: A mid-sized DTC skincare brand I worked with used predictive analytics to forecast demand during their holiday season. By analyzing previous purchase patterns and seasonal trends, they increased inventory for their top-selling moisturizer by 40% – and completely sold out without any stockouts. Meanwhile, they reduced overstock on slower products by 25%, improving their cash flow significantly.
This perfectly illustrates how leveraging ecommerce analytics reveals hidden opportunities that can transform your business performance and enhance customer experience.
Customer-Centric Growth Through Analytics
Here’s something you should know: modern consumers expect personalized experiences – 53% of shoppers prefer ecommerce brands that offer personalization. Smart data tracking enables you to understand your customer segments deeply, track their journeys from first visit to loyal advocate, and optimize every touchpoint along the way.
Another success story: An outdoor gear company noticed through their analytics that customers who bought hiking boots also frequently purchased water bottles within 30 days. They created a simple “complete your adventure kit” email series that increased their average order value by 35% and improved customer satisfaction scores.
Key eCommerce Metrics to Track – Your Performance Dashboard
Here’s what I’ve learned from helping dozens of online stores: successful ecommerce analytics requires tracking the right key metrics across your entire customer journey. I like to think of your metrics as a funnel that guides customers from awareness to advocacy through various marketing channels.
Let me break down the essential metrics I recommend you focus on:
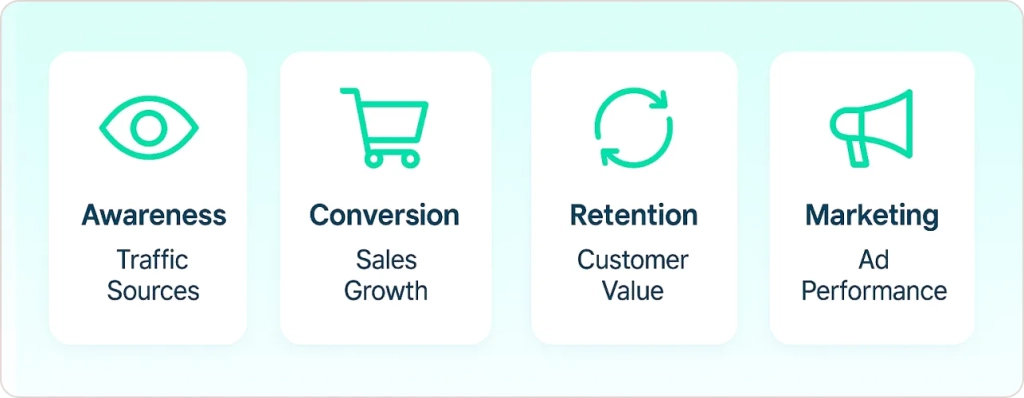
Awareness & Traffic Metrics
From my experience, understanding your traffic sources and user engagement patterns forms the foundation of your analytics strategy:
- Sessions & unique visitors: I always tell my clients this helps you measure your reach and audience growth for your online store
- Traffic sources: You’ll identify which marketing channels drive the most valuable visitors to your business
- Bounce rate: In my work, I’ve seen this shows you content relevance and site performance impact on customer experience
- Average session duration: This is one of my favorite metrics because you can gauge user engagement and interest levels across your customer journey
Conversion & Sales Metrics
These are the metrics I watch most closely because they directly tie to your revenue generation and business growth:
- Conversion rate: This is the percentage of visitors who complete a purchase – I typically see 2-3% for most online store operations
- Cart abandonment rate: With industry averages around 70%, I’ve helped many clients reduce abandonment through ecommerce analytics – it’s your massive opportunity
- Average order value (AOV): I always recommend you track this average order metric to improve through bundling, upselling, and cross-selling strategies
- Revenue per visitor: In my experience, this combines traffic quality with conversion effectiveness across your customer journey
Customer Value & Retention Metrics
Here’s what I’ve learned you need to track for long-term profitability through store performance tracking:
- Customer lifetime value (CLV): This represents the total revenue a customer generates over their relationship with your brand – I’ve seen this metric transform how my clients think about customer acquisition
- Repeat purchase rate: I help my clients measure customer loyalty and satisfaction through detailed performance analytics
- Customer acquisition cost (CAC): From my experience, you should ensure your customer lifetime value exceeds your CAC by at least 3:1
- Churn rate: I always recommend monitoring how many customers stop buying from your online store using analytics tools
Marketing Performance Metrics
I tell all my clients they need to optimize their marketing efforts with attribution and campaign analytics using reporting tools:
- Return on ad spend (ROAS): I’ve helped clients measure campaign profitability across all marketing channels through their analytics dashboard
- Cost per acquisition: In my work, I track acquisition costs by channel to help you optimize budget allocation for marketing campaigns using reporting tools
- Email open rates and click-through rates: I monitor email marketing effectiveness for my clients through comprehensive performance analytics
- Social media engagement: I help you understand which platforms drive meaningful interactions and conversions via analytics tools
For each metric I’ve mentioned, I always recommend you implement practical optimization strategies. For example, I’ve seen clients improve their average order value by implementing product bundling, or reduce cart abandonment by streamlining their checkout process with guest options and multiple payment methods.
Tools & Dashboards: Building Your Analytics Foundation
Let me guide you through the analytics tools landscape based on my years of experience. There are solutions for every business size and need, and I’ll help you understand which tools serve specific purposes to build an integrated analytics foundation for your business.
Web Analytics Platforms
Here’s what I always recommend my clients start with: Google Analytics 4 remains the cornerstone of most analytics strategies, offering comprehensive tracking for traffic, conversions, and user behavior across your online store. In my experience, if your business requires more advanced features, Adobe Analytics provides enterprise-level capabilities with enhanced segmentation and attribution modeling.
Ecommerce Reporting Tools and Integration
From my consulting work, I recommend these integrated reporting tools that centralize data from multiple sources:
- Looker Studio: I help my clients create custom dashboard solutions combining Google Analytics and advertising platforms
- Power BI: This is Microsoft’s robust solution that I often recommend for complex data visualization and business intelligence, perfect for comprehensive reporting
- Shopify Analytics: If you’re using Shopify, I tell my clients you get built-in analytics with specific metrics in your dashboard
- Supermetrics: I’ve set this up for many clients – it automates data collection from 100+ marketing platforms into your preferred reporting tools
Specialized Analytics Tools
Here are the specialized analytics tools you should consider for different aspects of your business:
- Hotjar and Crazy Egg: These tools provide heatmaps and session recordings that reveal user behavior patterns
- Kissmetrics: You’ll get advanced cohort analysis and customer journey tracking for detailed performance insights
- Klaviyo: This offers email marketing analytics with deep integration into your reporting setup
- Triple Whale: This is an all-in-one dashboard platform perfect for DTC brands
The key is creating a unified data flow from your sources to dashboards that provide real-time insights. I recommend you consider implementing automated KPI alerts through tools like Zapier or GA4 custom alerts.
If your business is ready to scale its analytics infrastructure, professional Google Analytics Consulting Services can accelerate your implementation and ensure optimal configuration.
Building Your Analytics Foundation: People, Process, and Infrastructure
Here’s what I’ve learned from working with hundreds of ecommerce businesses: successful ecommerce analytics requires more than just analytics tools – you need the right foundation of people, processes, and data infrastructure to support your store performance tracking.
Defining Goals and KPIs
Before I help any client dive into analytics tools, I always establish clear objectives tied to business outcomes. I recommend you focus on 3-5 primary key metrics that directly impact your success using your analytics dashboard:
- Increase revenue per visitor by 15% through personalization across your online store
- Reduce customer acquisition cost by optimizing high-performing marketing channels
- Improve customer retention by 25% through lifecycle marketing campaigns
- Boost average order value through strategic product recommendations tracked in your reporting tools
Data Integration and Management
From my consulting experience, you’ll need integrated performance analytics that connect all your data sources:
- Extract, Transform, Load (ETL) processes: I help my clients use reporting tools like Stitch or Fivetran to move data into a central warehouse
- Data quality management: I always help clients implement consistent naming conventions and ensure data accuracy in their analytics dashboard
- Customer ID unification: I work with you to match customer interactions across devices and touchpoints in the customer journey
- Real-time data processing: I help you enable timely decision-making with fresh data through analytics tools
I specialize in creating robust data infrastructure that scales with your business growth, ensuring your ecommerce analytics foundation supports both current needs and future expansion.
Leveraging Analytics for Sales Growth: Proven Strategies
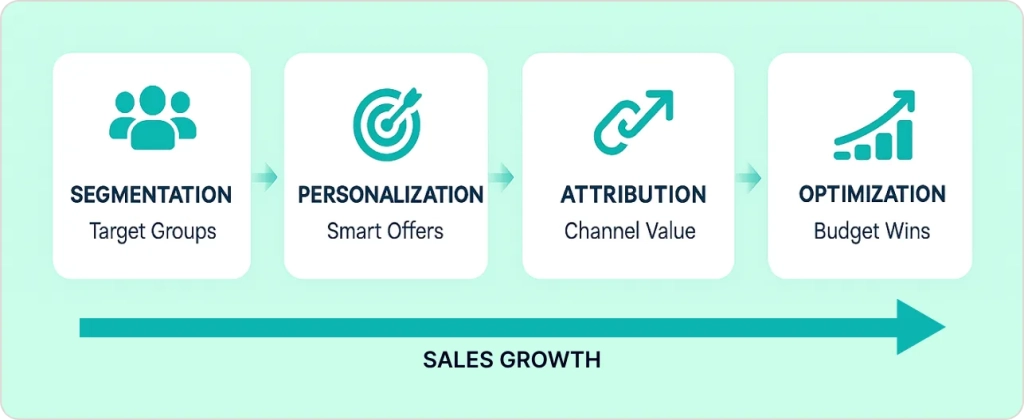
Data becomes powerful when you apply insights to drive specific business outcomes. Here are proven strategies successful online store operators use to boost performance.
Customer Segmentation for Targeted Marketing
You should segment customers based on behavior, value, and lifecycle stage using ecommerce performance analytics:
- VIP customers: High customer lifetime value customers who deserve premium treatment tracked through your ecommerce analytics dashboard
- First-time buyers: New customers who need nurturing through targeted marketing campaigns using ecommerce analytics tools
- At-risk customers: Previously active buyers showing signs of churn identified by ecommerce reporting tools
- Price-sensitive shoppers: Customers who respond to discounts across marketing channels analyzed via ecommerce performance analytics
You should use cohort analysis in Google Analytics or specialized ecommerce analytics tools to identify these segments and create targeted campaigns through your ecommerce analytics dashboard.
Personalization and Product Recommendations
Amazon’s recommendation engine drives 35% of their revenue by showing relevant products based on browsing history and customer behavior analyzed through ecommerce analytics tools. You can implement similar strategies using collaborative filtering and behavioral triggers through your ecommerce performance analytics and ecommerce reporting tools.
Marketing Attribution and Budget Optimization
You need to understand which marketing channels drive the highest ROI through ecommerce performance analytics:
- First-touch attribution: You should credit the first interaction that brings customers to your online store using ecommerce analytics tools
- Multi-touch attribution: You can distribute credit across all customer interactions in the customer journey via your ecommerce analytics dashboard
- Data-driven attribution: You should use machine learning to assign credit based on actual contribution to conversions tracked in ecommerce reporting tools
You need to allocate budget to marketing channels with the strongest performance while testing new opportunities for growth using your ecommerce analytics dashboard.
Overcoming Common Analytics Challenges
Ecommerce businesses face predictable challenges when implementing ecommerce analytics. Here’s how to address the most common obstacles:
Breaking Down Data Silos
When marketing, sales, and fulfillment data live in separate systems, you lose critical insights about what is ecommerce analytics supposed to achieve. Solutions include implementing a data warehouse to centralize all data for comprehensive ecommerce performance analytics, using integration platforms like Zapier or Segment, and standardizing data formats across platforms.
Privacy and Compliance in Analytics
With third-party cookies disappearing, successful ecommerce businesses are adapting their approach to what is ecommerce analytics in a privacy-first world by focusing on first-party data through email lists and loyalty programs, implementing cookieless tracking solutions for reliable data collection, and using Customer data platforms (CDPs) to unify customer segments data while maintaining privacy compliance.
Avoiding Analysis Paralysis
Too much data can overwhelm decision-making and obscure what ecommerce analytics truly meant to accomplish. Combat this by starting with core metrics, focusing on 3-5 key metrics that directly impact business outcomes, creating executive dashboards for quick decision-making, and establishing regular review cycles.
Emerging Trends Shaping eCommerce Analytics
The analytics landscape continues evolving rapidly. Staying ahead of these trends ensures your ecommerce businesses remain competitive:
AI and Predictive Analytics
Machine learning transforms historical data into future insights for demand forecasting, customer lifetime value modeling, dynamic pricing optimization, and chatbot analytics. According to Gartner, generative AI is now the most frequently deployed AI solution in organizations, making predictive analytics essential for competitive advantage.
Real-Time Analytics and Automation
Speed of insight drives competitive advantage through live dashboards that monitor performance during peak periods, automated alerts when key metrics hit thresholds, dynamic content optimization, and predictive inventory alerts to prevent stockouts.
Conclusion
Ecommerce analytics transforms raw data into actionable insights that drive measurable business growth. Companies that master store performance tracking thrive by making data-driven decisions faster than their competition.
The businesses winning in 2025 understand their customers deeply, optimize every touchpoint in the customer journey, and use analytics to guide strategic decisions.
Ready to unlock your online store’s potential? Whether you’re just starting to understand what is ecommerce analytics or ready to implement advanced predictive analytics, the key is taking action now.
Start tracking these essential key metrics today, and watch your data transform into a powerful engine for sustainable growth. If you want expert help setting up GA4, building a Power BI dashboard, or turning data into a growth engine, our consulting team can get you there fast. We specialize in transforming ecommerce data into clear, actionable insights that drive real business results.