Highlights
- Self-service BI eliminates IT bottlenecks, enabling independent data access without technical expertise
- Data-driven culture needs four pillars: leadership, technology, governance, and training
- Tools like Power BI, Tableau, and Qlik democratize data through drag-and-drop interfaces
- Implementations show 50% faster decisions and 85% higher employee engagement
- AI-enhanced analytics make business intelligence for non-technical users more accessible
- Success follows proven practices: pilots, phased rollouts, and continuous optimization
Introduction
“What if every employee in your organization could answer their own data questions in minutes instead of waiting weeks for IT reports? That’s the transformative power of self-service BI.”
Imagine walking into a company where every decision—from C-suite strategy to frontline operations—is backed by real-time data insights. Marketing teams optimize campaigns based on customer behavior analytics, sales managers adjust territories using performance dashboards, and operations staff identify bottlenecks through interactive reports. This isn’t a fantasy; it’s the daily reality in organizations that have successfully built a data-driven culture through self-service BI.
In today’s competitive landscape, Gartner research shows that CIOs rank analytics and BI as the top differentiating technology for their organizations. Gartner Says Self-Service Analytics and BI Users Will Produce More Analysis Than Data Scientists Will by 2019[1], with data and analytics leaders increasingly implementing self-service capabilities to create data-driven cultures. Yet despite this recognition, only about 30% of organizations give all departments access to data. This gap represents both a challenge and an enormous opportunity for forward-thinking businesses seeking to implement business intelligence for non-technical users.
Why Data-Driven Culture Matters (And the Roadblocks Today)
Organizations with a strong data-driven culture consistently outperform their peers. According to McKinsey research, data-driven companies are 23 times more likely to acquire customers and 6 times more likely to retain them. They make faster decisions, identify opportunities earlier, and adapt more quickly to market changes. However, most companies face significant roadblocks when implementing self-service BI:
Common Data Access Challenges
- Siloed data trapped in departmental spreadsheets
- IT bottlenecks where every report request creates delays
- Decision by HiPPO (Highest Paid Person’s Opinion) rather than evidence
- Limited data literacy across the workforce
These challenges create a vicious cycle where employees avoid using data because it’s too difficult to access, leading to gut-feel decisions and missed opportunities. This is precisely why democratizing data through accessible analytics becomes crucial for organizational success.
What is Self-Service BI? (Democratizing Data Analytics)
Self-service Business Intelligence is a modern approach that empowers everyone—not just data specialists—to access, analyze, and visualize data independently. Instead of waiting weeks for IT to generate reports, employees can create their own dashboards, explore trends, and answer questions in real-time. This represents the essence of business intelligence for non-technical users.
Traditional BI vs. Self-Service BI Comparison
| Aspect | Traditional BI | Self-Service BI |
|---|---|---|
| Data Access | Centralized control by IT teams | Democratizing data across organization |
| Report Generation | Request-based with bottlenecks | Drag-and-drop for business users |
| User Base | Limited to technical experts | Business intelligence for non-technical users |
| Speed | Slow turnaround for insights | Real-time decision-making |
| Flexibility | Static, predetermined reports | Interactive, customizable visualizations |
| Adoption | Limited departmental use | Broad organizational self-service analytics tools |
Think of traditional BI like a restaurant where only the chef can serve dishes. Self-service BI is like a buffet where everyone can choose what they want—the result is faster service and satisfied appetites for data insights.
For example, at DHL, implementing self-service analytics tools allowed teams to explore logistics data independently, uncovering temperature control issues in real-time that previously took days to identify through manual Excel analysis.
How Self-Service BI Drives a Data-Driven Culture
Self-service BI acts as a catalyst for cultural transformation by removing traditional gatekeepers to data. When anyone can access reliable information and analytics tools, data stops being an IT-owned asset and becomes a shared organizational language. This fundamental shift is key to building a sustainable data-driven culture.
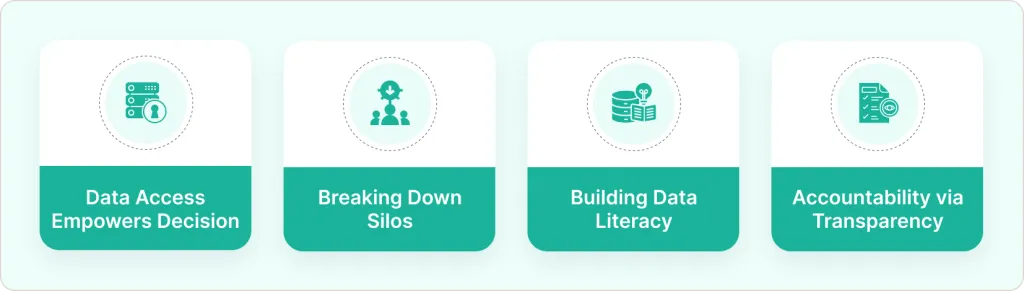
1. Data Accessibility Empowers Decisions
Wide data access (with proper security) means employees don’t have to rely on gut instincts. They can quickly check dashboards, run queries, and base decisions on evidence. This immediacy encourages teams to consult data as a first resort, not a last resort—a core principle of self-service bi best practices.
Key Benefits:
• No more waiting a week for last month’s sales report—managers can pull it in minutes
• Real-time decision-making capabilities • Increased confidence in data-driven choices
• Reduced dependency on IT for routine queries
2. Breaking Down Silos & Encouraging Collaboration
Self-service analytics tools typically integrate multiple data sources into unified platforms, providing a “single source of truth.” With broad access, departments start sharing insights rather than operating on separate spreadsheets, furthering the goal of democratizing data.
Marketing and Sales can explore the same customer dashboard together instead of arguing whose numbers are correct. This collaboration builds cross-functional trust and aligns teams around common metrics and definitions—essential components of a thriving data-driven culture.
3. Building Data Literacy and Curiosity
As more employees use self-service BI tools, their comfort with data naturally improves. Modern platforms feature intuitive drag-and-drop interfaces that make visualizing data approachable for business intelligence for non-technical users.
Research from Qlik shows one-third of employees believe data literacy helps them be more productive. Self-service BI acts as a hands-on training ground—as people explore dashboards and create simple charts, they develop analytical skills organically while following self-service bi best practices.
4. Fostering Accountability Through Transparency
When decisions are backed by data that everyone can verify through self-service analytics tools, it creates a culture of accountability. Open access to dashboards means honest conversations about performance, with data serving as the neutral arbiter rather than personal opinions or politics.
Benefits of Self-Service BI (Beyond the Buzzwords)
Implementing self-service BI as part of your data-driven culture strategy delivers measurable benefits:
Quantifiable Impact Areas
• Faster Decision-Making: 50% reduction in average decision turnaround time
• Increased Engagement: 85% more employees actively using data in daily work
• Cost Efficiency: 60% reduction in IT report generation requests
• Innovation: 3x more cross-departmental insights discovered
• Quality Improvement: 40% fewer data errors due to increased user validation
Faster, Evidence-Based Decisions
Self-service BI eliminates wait times for reports, enabling real-time decision-making. Organizations can react quickly to market changes and competitive threats while employees feel empowered rather than frustrated by delays.
Greater Employee Engagement
When non-technical staff have self-service analytics tools to explore data independently, they become more engaged with business outcomes. This grassroots involvement—where everyone contributes insights—is a hallmark of truly data-driven culture.
Reduced IT Bottlenecks
Less dependency on IT for routine analysis means technical teams can focus on strategic data governance, data quality initiatives, and advanced analytics projects rather than endless reporting requests. This aligns with self-service bi best practices for organizational efficiency.
The Four Pillars of Data-Driven Culture with Self-Service BI
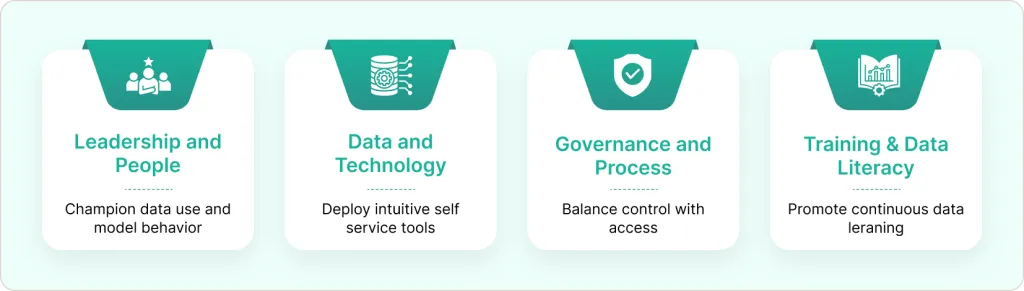
Building a sustainable data-driven culture requires more than just implementing technology. Based on our experience in business intelligence consulting services, successful self-service BI transformations rest on four critical pillars:
Pillar 1: Leadership & People
Leadership must actively champion data-driven decisions by consistently asking “What do the numbers show?” in meetings. According to Harvard Business Review, organizations with strong executive sponsorship are 5x more likely to succeed in data initiatives.
Leadership Actions: • Model data-driven behavior in executive meetings • Identify enthusiastic users as data champions • Update job descriptions to include data competencies • Reward evidence-based decision-making in performance reviews
Pillar 2: Data & Technology Infrastructure
Choose self-service analytics tools that prioritize ease of use for business intelligence for non-technical users. Popular platforms include:
Tool Comparison:
• Power BI: Familiar interface for Excel users with strong Microsoft ecosystem integration
• Tableau: Renowned for intuitive visualizations and robust community support
• Qlik Sense: Powerful associative engine for uncovering hidden insights and relationships
Pillar 3: Governance & Process
Establish data governance frameworks early to balance freedom with control. Forrester research indicates that organizations with robust governance frameworks see significantly better user adoption rates and analytics success.
Governance Framework:
• Role-based access controls and audit logs
• Certified datasets and data quality standards
• Center of Excellence for metric definitions
• Clear escalation paths for data issues
Pillar 4: Training & Data Literacy
Develop comprehensive training programs covering both technical tool usage and broader data interpretation skills. Host monthly “Data Hours” where employees share insights, run internal analytics contests, and create communities of practice.
Training Components:
• Initial tool onboarding (2-4 hours)
• Advanced feature workshops (monthly)
• Data interpretation skills (quarterly)
• Peer learning communities (ongoing)
Step-by-Step Implementation Guide
Implementation Phases
| Phase | Duration | Key Activities | Success Metrics |
|---|---|---|---|
| Assessment | 2-4 weeks | Culture survey, tool evaluation | Baseline metrics established |
| Pilot | 8-12 weeks | Single department rollout | 70% user adoption in pilot group |
| Scale | 6-12 months | Organization-wide deployment | 60% company-wide adoption |
| Optimize | Ongoing | Governance refinement | Continuous improvement metrics |
1. Assess Current State & Set Goals
Start with a data-driven culture maturity assessment. Survey employees about their current data usage, comfort levels, and biggest frustrations with existing systems. Define success metrics like “80% of managers use self-service BI tools monthly” or “average decision turnaround time reduced by 50%.”
2. Secure Executive Sponsorship
Align leadership on the self-service BI vision and secure both budget and public support. Executives should model the behavior they want to see by referencing dashboards in meetings and asking for data backing major decisions.
3. Choose Tools & Prepare Infrastructure
Select platforms based on user-friendliness, integration capabilities, and scalability. Following self-service bi best practices, ensure your data preparation processes and data modeling support self-service needs—clean, well-structured data is essential for user confidence.
4. Pilot with High-Impact Use Cases
Start with one department and a specific business challenge (like sales performance dashboards). Gather feedback, create success stories, and refine your self-service BI approach before broader rollout.
5. Scale Through Training & Support
Conduct comprehensive training for different user levels on self-service analytics tools (basic for end-users, advanced for power users). Create internal newsletters showcasing “insight of the week” discoveries to maintain momentum.
Overcoming Common Implementation Challenges
Challenge Resolution Matrix
| Challenge | Impact Level | Solution Approach | Timeline |
|---|---|---|---|
| User Resistance | High | Champions program + quick wins | 4-8 weeks |
| Data Quality Issues | Medium | Governance framework + training | 8-12 weeks |
| Security Concerns | High | Role-based access + audit trails | 2-4 weeks |
| Tool Complexity | Medium | Simplified interfaces + support | Ongoing |
Resistance to Change
Solution: Focus on easy wins and provide hands-on support with self-service BI tools. Find influential advocates in each team who can demonstrate business intelligence for non-technical users value to skeptical colleagues.
Data Quality Concerns
Solution: Implement robust governance with certified datasets, data quality monitoring, and clear escalation paths for issues. Provide training on proper data interpretation using self-service analytics tools.
Real-World Transformation: AlphaCorp’s Journey
Consider AlphaCorp, a mid-size manufacturing company where only the BI team generated reports. Employees waited days for simple analysis, leading to delayed decisions and missed opportunities—the opposite of a data-driven culture.
Transformation Results
After implementing self-service BI with comprehensive training and governance:
6-Month Results:
• 85% of managers actively used self-service analytics tools monthly
• Decision turnaround time dropped from 5 days to same-day
• Cross-departmental collaboration improved through shared data views
• Employee engagement scores increased by 40%
• Cost savings of $200K annually from reduced IT reporting overhead
Optimizing for the Future: AI and Beyond
Forward-thinking organizations are preparing for the next evolution of self-service BI and democratizing data. According to Gartner’s trends research, augmented analytics capabilities will drive the future of business intelligence platforms.
Emerging Capabilities
• Augmented Analytics: Automatic insight discovery and anomaly detection
• Natural Language Processing: Ask questions in plain English
• Embedded Analytics: Context-aware insights in daily workflows
• AI-Powered Recommendations: Suggested charts and narrative explanations
Self-service analytics tools with these capabilities further reduce barriers for business intelligence for non-technical users, making data analysis as simple as having a conversation.
Your Next Steps Toward Data-Driven Culture
Building a data-driven culture through self-service BI requires strategic planning, executive commitment, and ongoing investment in both technology and people development. Organizations that successfully implement self-service bi best practices consistently outperform competitors through faster decisions, better customer insights, and more agile responses to market changes.
Success in democratizing data comes from treating this as an organizational change initiative, not just a technology project. The most effective implementations combine the right self-service analytics tools with comprehensive training, robust governance, and strong leadership support.
Whether you’re just beginning to explore business intelligence for non-technical users or ready to scale an existing program, the key is starting with a clear strategy and commitment to building capabilities that will serve your organization for years to come.