Introduction: Why This Comparison Matters
In today’s data-driven world, making the right business decisions often starts with picking the right analytics tools. Both Power BI and Tableau help organizations turn raw data into clear, visual insights – but they have different strengths.
Power BI and Tableau dominate the BI market, so many analysts and business owners find themselves wondering which tool is better for their situation. In fact, as one tutorial notes, “learners, practitioners, and researchers come into a dilemma when deciding which one of the tools they should learn or use” Choosing the right tool can save time and money, and help your team explore data more effectively.
This article will compare Power BI vs Tableau in simple terms. We’ll look at what each tool is, highlight their main differences, compare how they build dashboards, and cover topics like cost and migration. By the end, you’ll have a clear picture of which BI tools might fit your needs best.
Why the Right BI Tool Matters in 2025

By 2025, businesses of all sizes are awash in data – from sales and customer info to social media and web metrics. Being able to turn raw numbers into clear charts and dashboards is critical for smart decisions. In fact, a recent Salesforce survey finds 76% of business leaders now feel pressured to back every argument with data.
That’s a lot of pressure! The right Business Intelligence tool – like Power BI or Tableau – acts like a translator between you and your data, turning confusing spreadsheets into easy visuals. In an uncertain economy with tight budgets, choosing the right tool can give you an edge.
Data visualization in action – BI tools help turn raw numbers into charts so you can see trends at a glance.
What Are Power BI and Tableau?
- Microsoft Power BI: A self-service analytics service launched in 2011. Power BI lets you import, model and visualize data in interactive reports and dashboards. It integrates tightly with Microsoft products. Power BI has a familiar Office-like interface, and is designed to be easy for non-programmers.
- Tableau: Introduced in 2004, Tableau popularized drag-and-drop data visualization. It offers a suite of products for data prep and analysis. Tableau can connect to a very wide range of data sources and emphasizes visual flexibility. It runs on Windows and macOS and is known for its rich, advanced charting capabilities.
Both platforms are highly popular – Gartner reports that Power BI and Tableau are the #1 and #2 BI tools by market share. They both let you create interactive dashboards, filter and drill into visuals, and connect to many data sources. In short, both are powerful BI tools for data-driven decision-making, but they shine in different ways.
Difference between Power BI vs Tableau: Feature Comparison
| Feature | Power BI | Tableau |
|---|---|---|
| Owner / Vendor | Microsoft | Salesforce (acquired Tableau) |
| Initial Release | 2011 (public launch) | 2004 (first launch) |
| Platform Support | Windows (Desktop app); Web service; no native Mac app | Windows, macOS, and Web/Cloud |
| Data Connectors | 100+ connectors (Excel, SQL, cloud sources, etc.) | 100+ connectors (including AWS, Google, Salesforce) |
| Data Model & Prep | Power Query/Power Pivot (in-memory/tabular modeling) | Tableau Prep or live extracts (originally preferred wide tables) |
| Visualization | Large library of chart types; dashboard templates | Very rich, customizable charts and storyboards |
| Ease of Use (UI) | Office-like interface; familiar for Excel/Office users | Intuitive drag-and-drop; built for analysts |
| Advanced Analytics | DAX formulas, AI visuals, integrated with Azure ML | LOD expressions, advanced calculations, growing AI features |
| Mobile App | Strong native apps for iOS/Android (Power BI Mobile) | Mobile-friendly views, plus dedicated iOS/Android apps |
| Pricing (per-user) | Pro: ~$14/user/mo (annual)Premium Per User: ~$24 | Creator: $75/user/mo (annual)Explorer: $42Viewer: $15 |
| Free Version | Power BI Desktop (free to use locally; sharing limited) | No full free tier (14-day trial; free Tableau Public cloud with restrictions) |
The table highlights key differences. Power BI is built into the Microsoft ecosystem and is generally cheaper at scale. Tableau was built from the ground up for analytics, so it has more flexible visualization options and cross-platform support. Both can connect to dozens of data sources and handle real-time data updates.
Power BI Dashboards vs Tableau Dashboards
When it comes to building dashboards and visuals, each tool has its style.
Both tools let you build interactive dashboards by dragging charts, tables and filters onto a canvas. For example, you might pull in sales data and then create a bar chart and a map that appear together on one screen.
Tableau dashboards are known for being highly customizable – you can float objects anywhere and design pixel-perfect layouts. It “provides extensive visualizations” and is especially strong at making beautiful, detailed dashboards.
Power BI dashboards, on the other hand, use a fixed tile-based canvas (think of pinning charts to a canvas). This makes building dashboards quick and structured, but slightly less freeform. Power BI’s style is more “aligned” with Office design (grids, header, tiles).
In short:
- Power BI dashboards are great for quickly assembling standard charts in a familiar interface (Excel/Windows users pick this up fast). They tie into Microsoft services and even offer simple AI tools to help you explore data.
Power BI’s visuals are somewhat more basic out of the box, but you can add custom visuals from the marketplace if needed.
- Tableau dashboards are unbeatable for advanced visuals and fine control. They allow highly customizable, interactive designs that help tell a data “story.” Many analysts find Tableau’s drag-drop interface very powerful once they learn it.
To summarize the dashboard differences:
- Power BI: User-friendly, great for beginners, tight Office 365 and Azure integration. Ideal when you need quick, clean dashboards and you’re in a Microsoft environment.
- Tableau: Highly flexible visuals, extensive chart options, multi-platform (Windows & Mac) support. Best when you need sophisticated, customized dashboards and have the time to leverage its full power.
In practice, you might try both on a small project: see which interface feels more intuitive to you and your team, and which one helps you visualize the data stories you want to tell.
Power BI vs Tableau Pricing
Cost is a major factor for small businesses. Here’s how Power BI vs Tableau Pricing they compare (all USD, per user/month, billed annually):
- Power BI:
- Power BI Desktop: Free to install (create and view reports on your local machine).
- Power BI Pro: $14.00/user/month (required for sharing, collaboration, app workspaces).
- Premium Per User (PPU): $24.00/user/month (adds bigger models and frequent refresh).
- Premium Capacity: Starts around $4,995/month (dedicated cloud capacity, supports more users).
A free Power BI License Service tier exists, but it has limited sharing capability (mainly for individual work).
- Tableau:
- Creator: $75/user/month (includes Tableau Desktop, Prep Builder, and one Cloud/Server license).
- Explorer: $42/user/month (browsing and limited creation).
- Viewer: $15/user/month (view/interact only).
Tableau also offers Tableau Cloud (hosted SaaS) vs Tableau Server (on-prem), but licensing is per-user as above. (There is also Tableau Public, which is free but public data only.)
Below is a quick Power BI vs Tableau pricing summary:
Image Alt Tag: Power BI vs Tableau pricing summary
In short, Power BI tends to win on price and ease-of-use within MS environments, while Tableau wins on visual power and platform flexibility. The right choice depends on your data strategy and budget.
Advantages and Disadvantages of Power BI
Advantages of Power BI:
- Integration with Microsoft: Because it’s built by Microsoft, Power BI plugs in easily to Excel, Azure, SharePoint, Teams, and other MS products. This lets you bring in data from Office files or publish reports to SharePoint/Teams seamlessly.
- Ease of Use: Power BI has an intuitive drag-and-drop interface geared toward business users. You can quickly create reports without writing code or complex queries. Many users say they can be productive in hours.
- Fast Data Processing: Power BI handles large datasets efficiently (especially with Power BI Premium or Fabric). It uses in-memory compression (VertiPaq engine) so dashboards update quickly and users can slice & filter on the fly.
- Affordable Pricing: There’s a free Desktop version and a modest Pro subscription (~$10/user/month). In fact, many businesses get Power BI Pro included in their Microsoft 365 plans. Even the Premium tiers are relatively lower-cost per user than most Tableau seats.
- Built-in AI and Analytics: Power BI includes features like Q&A (type a question to generate visuals) and easy integration with Azure Machine Learning. New AI tools (Copilot) are also being added for Premium users, helping automate insights.
Disadvantages of Power BI:
- Windows-Centric (Desktop Only on Windows): The Power BI Desktop application runs only on Windows. If your team uses Mac or Linux laptops, they’ll need to rely on the web service or run Power BI in a virtual machine. In contrast, Tableau offers native Windows and Mac apps.
- Customization Limits: Power BI’s out-of-the-box visuals are somewhat less flexible than Tableau’s. You may find fewer chart types or styling options built in. Simplilearn notes that Power BI’s customization is a bit “limited” compared to Tableau.
- Free Version Limits: The free Desktop version of Power BI is great for personal use, but it has restrictions on sharing and data size. For example, the free tier has lower data capacity and no scheduled refreshes. To collaborate with others, you’ll need at least Power BI Pro.
- Tied to Microsoft Stack: To get the most out of Power BI, you often rely on other Microsoft technologies (like Azure, SQL Server, or Office 365). If your data lives mostly outside the Microsoft world, you might need more setup (data gateways) or miss out on some integrated features.
Overall, Power BI’s strengths are its seamless Microsoft ties, user-friendliness, and low cost. Its trade-offs are mostly around some feature limits and platform dependency.
Advantages and Disadvantages of Tableau
Advantages of Tableau:
- Data Visualization Power: Tableau is famous for stunning visuals. It offers a huge library of charts (bar, line, scatter, maps, bullet charts, box plots, area charts, etc.) and lets you tweak layouts and colors in great detail.
- Flexibility: Tableau connects to almost anything – spreadsheets, SQL databases, cloud data lakes (AWS, Google), and web services (Salesforce, Google Analytics, etc.). You can drag fields onto visualizations with a lot of freedom. This makes it well-suited for complex, multi-source analytics.
- Customization: Everything is tunable. You can customize tooltips, actions, filters, and each design element. Power users love that they can adjust almost any aspect of a chart. (For example, Tableau lets you embed detailed explanations and add custom HTML or images into dashboards.)
- Community and Support: Tableau has built a passionate user community (“DataFam”) over many years. There are extensive free resources, active forums, user groups, and Tableau Public sharing thousands of dashboards. Even their website emphasizes free training and user support, so beginners can find help.
Disadvantages of Tableau:
- Higher Cost: Tableau’s full-feature licenses are significantly more expensive. A Tableau Creator seat (with full Designer and Prep tools) runs around $70–75 per user/month, while even the basic Viewer license is about $15. For large teams, those fees add up.
- Steep Learning Curve: Tableau’s flexibility comes with complexity. New users often find it harder to master than Power BI. Tasks like data modeling and building sophisticated dashboards can require more training.
- Performance on Huge Data: In some cases, Tableau can slow down with massive datasets or complex calculations. While both Tableau and Power BI can handle big data with the right setup (e.g. extracts or in-memory engines), Tableau may require more tuning or powerful servers for very large models.
- Not Built for Real-Time Data: Tableau traditionally focuses on batch or periodic data analysis. If you need live streaming dashboards (updating by the minute), other tools might handle that better.
In summary, Tableau’s pros are its unmatched visualization range, customization, and strong community. Its cons are mostly about cost and complexity.
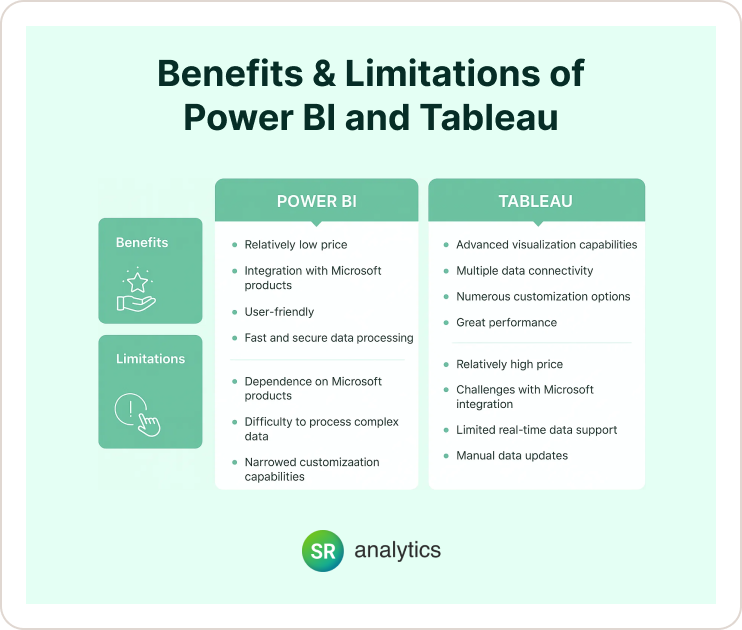
Tableau to Power BI Migration – Is It Worth It?

Switching from one tool to another takes planning. Here are some quick migration tips:
- Audit your reports: List which dashboards and metrics are most important. You’ll likely need to rebuild visuals manually in the new tool. There’s no automated “one-click” converter, so factor in development effort.
- Map data models carefully: Tableau often uses wide tables or blends, whereas Power BI encourages star schemas and explicit relationships. When migrating, plan how to replicate calculated fields (DAX vs Tableau LOD expressions).
- Check data access and permissions: Make sure the new tool can connect to your data sources (databases, files, APIs). You may need updated connectors or driver setups.
- Train your team: Provide training on the new platform’s interface and formulas (DAX for Power BI, Table calculations for Tableau). Small demos can ease the transition.
- Use both in parallel (if possible): During migration, run the old and new dashboards side by side on sample data to validate outputs before fully cutting over.
- Leverage checklists or consultants: Consider a migration checklist or expert help to ensure governance and deployment best practices.
Migrating BI tools is a major step. Take inventory of your needs, build a phased plan, and migrate strategically.
Final Verdict Power BI vs Tableau: Which is Better?
There’s no absolute winner – it really depends on your needs. Both Power BI and Tableau are powerful, industry-leading tools. Power BI tends to be the go-to for organizations already using Microsoft technologies or watching their spend.
Its user-friendly design and tight Office integration make it easy to adopt. Tableau is often preferred by data teams that need rich visual storytelling, flexibility, and the ability to handle very large, complex data. It also appeals to Mac users or companies in non-Microsoft environments.
In practice, many data professionals end up learning both. Skills in one often translate to the other, since core concepts (like drag-and-drop analytics) are similar. Think about factors like: What OS and tools does your team use? How much data do you have? What’s your budget? And perhaps most importantly, try them out.