Highlights
- 97% of organizations using Microsoft Power BI report faster decision-making within 6 months
- 270% ROI over 3 years according to Forrester’s Total Economic Impact study
- $9.99/month per user makes enterprise-grade bi analytics accessible to small businesses
- 100+ data connectors unify scattered data sources into unified Power BI dashboards
- Gartner Magic Quadrant Leader for 13+ consecutive years in analytics and business intelligence platforms
- Real-time Power BI reporting replaces static monthly reports with live, actionable Power BI data analytics
Introduction
If you’re still making business decisions based on outdated spreadsheets or gut feelings, you’re already falling behind.
When I first started working with data-driven teams, one thing became clear—most businesses aren’t short on data. They’re short on clarity. That’s why I believe Microsoft Power BI isn’t just another reporting tool—it’s the single most transformative force in business intelligence today.
Most organizations today are buried under a mountain of data, yet struggle to extract anything meaningful from it. Spreadsheets live in silos, reports are outdated before they’re read, and decision-makers are left guessing instead of acting with confidence.
I’ve seen this challenge firsthand while working with companies of all sizes—from startups to enterprise teams. Despite having access to data, they lack the visibility and alignment needed to turn numbers into strategic advantage.
Microsoft Power BI changes that. It bridges the gap between raw data and real business outcomes by delivering insights when and where they matter most. It empowers every user—technical or not—to explore trends, surface opportunities, and respond to challenges in real time.
Here’s a shocking reality: According to Harvard Business Review research, companies that embrace data-driven decision making are 5% more productive and 6% more profitable than their competitors. Yet most businesses are still operating in the dark, making million-dollar decisions based on incomplete information.
In the sections ahead, I’ll break down exactly how Power BI helps you turn disconnected data into a unified story—driving clarity, speed, and smarter decision-making across your organization.
Why Microsoft Power BI is Changing the Business Intelligence Game
Here’s what I always tell my clients: the best Microsoft Power BI features aren’t the flashiest ones—they’re the Power BI tools that actually get used by your team every day to drive better business outcomes through bi analytics.
Leader in BI Analytics for Innovation & Continuous Evolution
Microsoft didn’t become a Gartner Magic Quadrant Leader for 13 consecutive years by accident. According to Gartner’s latest report, Microsoft Power BI leads in execution and completeness of vision. When I evaluate bi analytics platforms for clients, I look for three critical factors: ease of adoption, continuous innovation, and proven track record at scale.
Microsoft Power BI delivers on all three. Companies like Walmart, Bank of America, and IBM rely on Power BI tools to manage billions of data points daily. But here’s what impresses me most: Microsoft releases new Power BI features and improvements monthly, not annually. This means your Power BI data analytics investment keeps getting better without additional costs, maximizing the benefits of Power BI over time.
The numbers speak volumes: from zero users in 2015 to over 30,000 companies today, Microsoft Power BI’s adoption rate outpaces every competitor in the bi analytics space. This isn’t just market momentum—it’s validation from real businesses seeing real benefits of Power BI implementations.
From Data to Decisions, Faster Than Ever
Traditional Power BI reporting follows a predictable pattern: data gets collected, IT processes it, reports get generated weeks later, and by the time decisions are made, market conditions have already shifted. I’ve seen companies miss million-dollar opportunities because their decision-making process was stuck in the past.
Microsoft Power BI fundamentally changes this dynamic through real-time Power BI data analytics. When Delta Airlines implemented Power BI reporting for customer service monitoring, their teams could see customer feedback as it happened, enabling instant responses to issues instead of discovering problems weeks later through traditional reports.
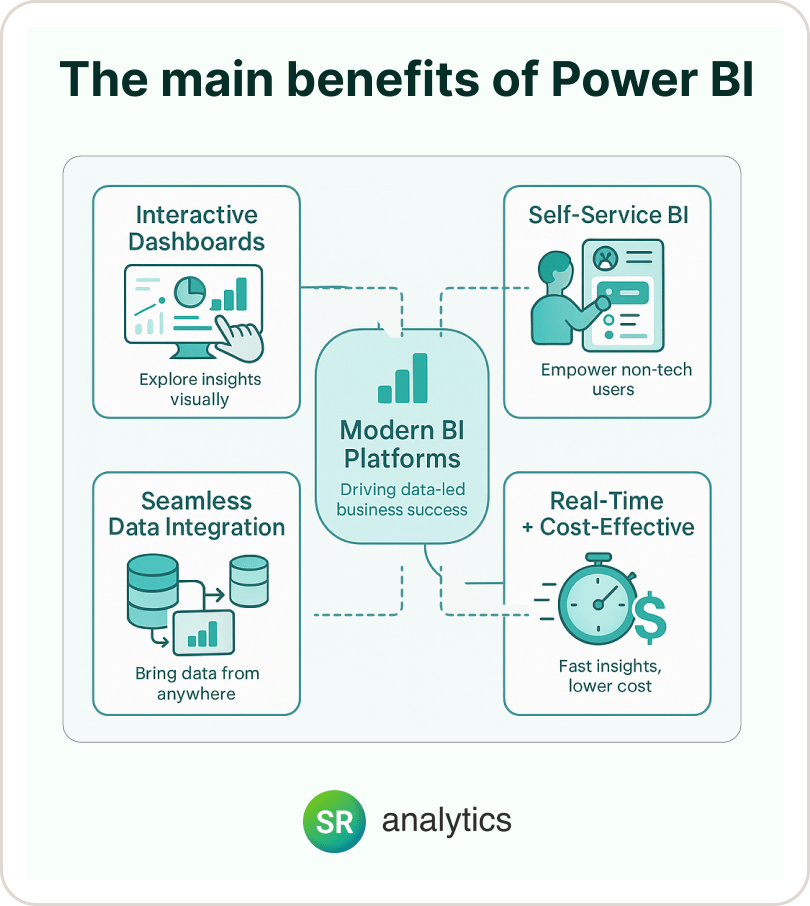
Interactive Power BI Dashboards for Data-Driven Decisions
The difference between good data and great insights often comes down to one thing: effective Power BI visualizations. I’ve watched executives’ eyes light up when they see their first interactive Microsoft Power BI dashboard—suddenly, patterns that were invisible in spreadsheets become obvious through powerful Power BI tools.
Goodbye, Gut Feeling – Hello, Power BI Insights
Let me share what happens when businesses transition from intuition-based to data-driven decision making through Power BI data analytics. A manufacturing client was hemorrhaging cash on what seemed like their best-selling product line. Traditional reports showed strong revenue, but Power BI visualizations revealed the complete picture: high sales volume with razor-thin margins and excessive support costs.
Power BI dashboards make trends and outliers obvious at a glance. Interactive Power BI charts allow users to drill down from high-level trends to specific transactions with a single click. This level of exploration was previously reserved for data analysts—now any manager can uncover insights independently using Microsoft Power BI tools.
The magic happens when data becomes accessible to everyone, not just technical teams. When marketing, sales, and operations all look at the same Microsoft Power BI dashboard, finger-pointing stops and problem-solving begins. According to Tableau’s research on data culture, organizations with strong data cultures are 5x more likely to make decisions quickly.
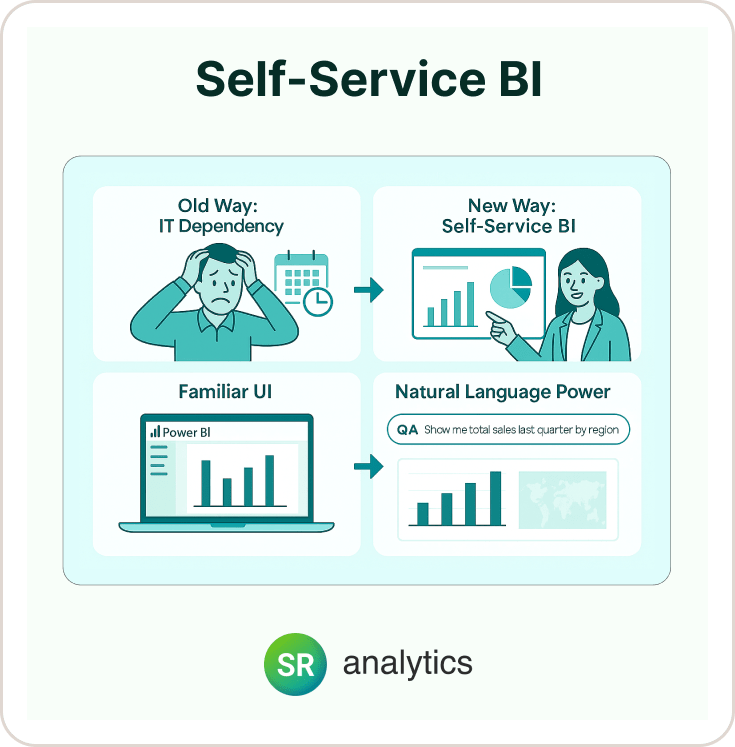
Self-Service BI – Empowering Every User with Power BI Tools
Here’s what I’ve learned from implementing Microsoft Power BI solutions across hundreds of organizations: the biggest barrier to data adoption isn’t technology—it’s accessibility to effective Power BI tools.
Traditional bi analytics creates dependencies. Business users submit requests to IT, wait weeks for custom reports, receive something that’s 80% right, then start the cycle over again. This process kills momentum and frustrates everyone involved.
Minimal Training, Maximum Productivity with Power BI Features
Microsoft Power BI’s learning curve for basic use is surprisingly gentle. If your team can navigate Excel, they can start creating meaningful Power BI reporting within days, not months.
Here’s what I always ask new clients: “How much of your IT team’s time gets consumed by ad-hoc reporting requests?” The answer is usually 30-40%. After Microsoft Power BI implementation, that number drops to under 10%. Business users creating their own Power BI dashboards frees up IT for strategic projects instead of reactive requests.
The training requirement is minimal because Power BI tools leverage familiar concepts. DAX formulas work similarly to Excel functions. The drag-and-drop interface feels intuitive. Most importantly, users can start simple and gradually build complexity as their confidence with Power BI data analytics grows.
Natural Language Q&A: Revolutionary Power BI Features
This is where Microsoft Power BI truly shines: natural language processing that turns business questions into instant Power BI visualizations. Instead of building complex queries, users simply type: “Show me total sales last quarter by region” and watch Power BI generate the appropriate chart using advanced Power BI features.
Pro tip: This feature dramatically accelerates user adoption. When executives can get answers by asking questions in plain English through Power BI tools, they stop avoiding the system and start using it daily. According to Microsoft’s research on self-service analytics, organizations with high Power BI adoption see 23% faster decision-making.
Seamless Data Integration – All Your Data on One Microsoft Power BI Platform
Data silos are the enemy of good decision-making. I’ve seen companies with customer data in Salesforce, financial data in QuickBooks, inventory data in Excel, and website analytics in Google Analytics—all telling different versions of the same story through fragmented bi analytics.
Microsoft Ecosystem Advantage in Power BI Analytics
Microsoft Power BI’s tight integration with Microsoft’s ecosystem provides immediate value for most businesses. One-click exports to PowerPoint mean presentations always reflect current data. Excel integration allows familiar analysis workflows. Teams and SharePoint integration makes Power BI reporting sharing seamless across your organization.
But the real advantage extends beyond Microsoft products. Power BI tools connect to Azure Synapse for big data processing, Power Platform for automation, and Microsoft Fabric for advanced analytics. This isn’t just a reporting tool—it’s part of a comprehensive business platform that amplifies the benefits of Power BI across your entire tech stack.
Combining Multiple Data Sources: The Holistic Power BI View
Here’s a real-world example that illustrates Microsoft Power BI’s integration power: A retail company was struggling to understand why their online sales were declining despite increased website traffic.
Power BI unified data from Google Analytics, Shopify, Mailchimp, Facebook Ads, and customer service tickets. The integrated Power BI dashboard revealed that website speed issues were causing cart abandonment, particularly on mobile devices. This insight was invisible when data lived in separate systems, but obvious when visualized together through comprehensive Power BI data analytics.
According to recent McKinsey research on integrated analytics, businesses using integrated data platforms make decisions 5x faster than those relying on siloed systems. Additionally, Deloitte’s analytics study shows that insight-driven organizations using tools like Microsoft Power BI are growing at an average of more than 30% annually.
Real-Time Analytics and Cost-Effective BI with Microsoft Power BI
The difference between reacting to problems and preventing them often comes down to timing. Monthly reports tell you what happened. Real-time Microsoft Power BI dashboards tell you what’s happening right now through advanced Power BI data analytics.
Instant Awareness Through Power BI Tools
I always emphasize this to clients: real-time doesn’t mean overwhelming. It means having current information available when decisions need to be made. Microsoft Power BI’s DirectQuery and streaming datasets enable Power BI dashboards that refresh automatically as source data changes, delivering immediate benefits of Power BI.
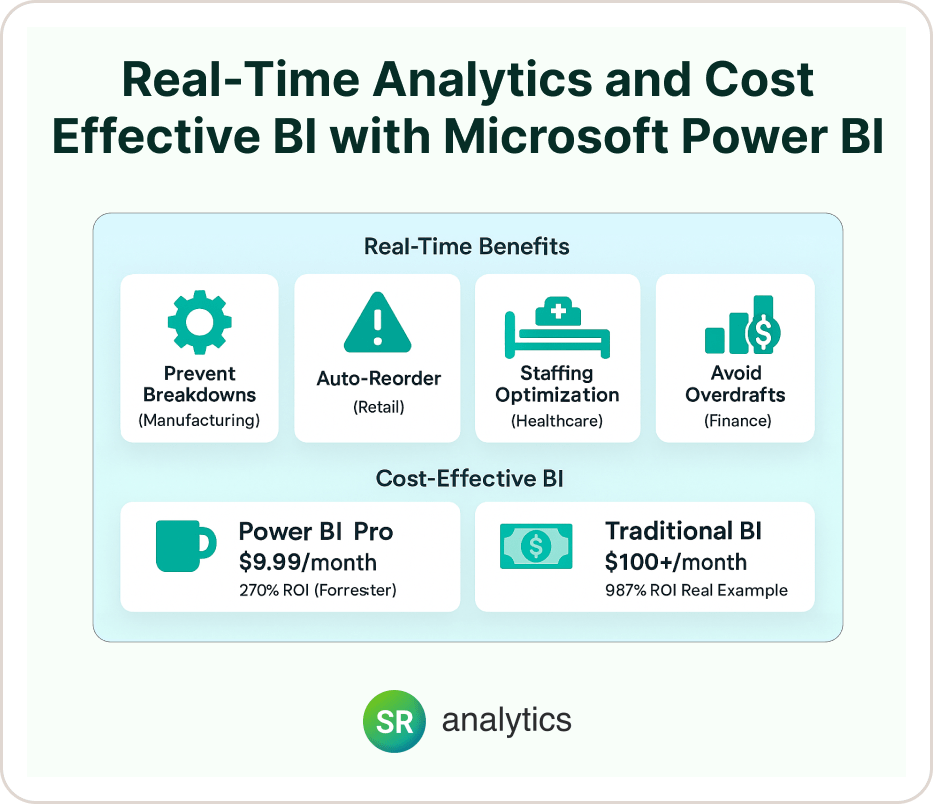
Consider these scenarios where real-time Power BI reporting matters:
- Manufacturing: Equipment efficiency monitoring that alerts supervisors to problems before breakdowns occur through Power BI visualizations
- Retail: Inventory levels that trigger reordering automatically through Power BI analytics
- Healthcare: Patient flow monitoring that optimizes staffing in real-time using Power BI tools
- Finance: Cash flow monitoring that prevents overdrafts using comprehensive Power BI data analytics
Red flag alert: If your team learns about problems from customers instead of internal Microsoft Power BI dashboards, your bi analytics aren’t fast enough.
Exceptional ROI from Microsoft Power BI
Here’s my rule: if your Power BI tools cost more than the insights they provide, you’re doing it wrong.
Microsoft Power BI Pro costs $9.99 per user per month—less than most teams spend on coffee. Compare this to traditional bi analytics solutions that often require $50-100+ per user monthly, plus significant implementation costs.
Forrester’s Total Economic Impact study found that organizations achieve 270% ROI over three years using Microsoft Power BI. According to IDC’s business value study, organizations using Microsoft Power BI see these returns through faster decision-making, automated Power BI reporting, better resource allocation, and reduced IT overhead.
Real example: A mid-size distribution company invested $15,000 annually in Microsoft Power BI licensing for 150 users. Within six months, they identified through Power BI analytics:
- $78,000 in annual savings through optimized delivery routes using Power BI visualizations
- $45,000 reduction in inventory carrying costs via Power BI dashboards
- $25,000 decrease in reporting overhead through automated Power BI features
Total first-year ROI: 987%. This isn’t exceptional—it’s typical when Microsoft Power BI investments align with operational improvements and organizations fully leverage the benefits of Power BI.
Advanced Power BI Features and Enterprise Security
Beyond basic Power BI dashboards, Microsoft Power BI serves as a comprehensive platform for sophisticated bi analytics. This future-proofing capability means your Power BI data analytics investment scales with your analytical maturity while continuously delivering expanded benefits of Power BI.
AI-Powered Power BI Insights

Microsoft Power BI’s artificial intelligence features democratize advanced analytics through intuitive Power BI tools:
- Quick Insights automatically detect patterns and anomalies in Power BI data using machine learning
- Key Influencers visually identifies factors driving specific outcomes through advanced Power BI visualizations
- Decomposition Tree breaks down metrics across multiple dimensions using intelligent Power BI features
- Anomaly detection highlights unusual patterns requiring attention in real-time Power BI reporting
Here’s what I look for: AI that enhances human decision-making instead of replacing it. Microsoft Power BI’s approach provides suggestions and highlights patterns through sophisticated bi analytics, but leaves interpretation and action planning to users.
Enterprise-Grade Security in Power BI Tools
Enterprise adoption requires enterprise-grade security. Microsoft Power BI inherits Microsoft’s comprehensive security framework, ensuring that your Power BI data analytics remain protected:
- Data encryption in transit and at rest for all Power BI reporting
- Azure Active Directory integration for seamless identity management across Power BI tools
- Row-level security controls access down to individual records in Microsoft Power BI dashboards
- Compliance certifications including GDPR, HIPAA, SOC 2, and ISO 27001 for all Power BI features
Here’s what I always ask: “What’s riskier—having secure, centralized data access through Microsoft Power BI tools or continuing with uncontrolled spreadsheet sharing?” The answer is usually obvious when you consider the comprehensive benefits of Power BI security.
According to Microsoft’s Trust Center documentation, Power BI maintains the same enterprise-grade security standards as other Microsoft 365 services, with over $1 billion invested annually in cybersecurity.
Real-Life Microsoft Power BI Success Story
Case Study: Transforming Inventory Management with Power BI Analytics
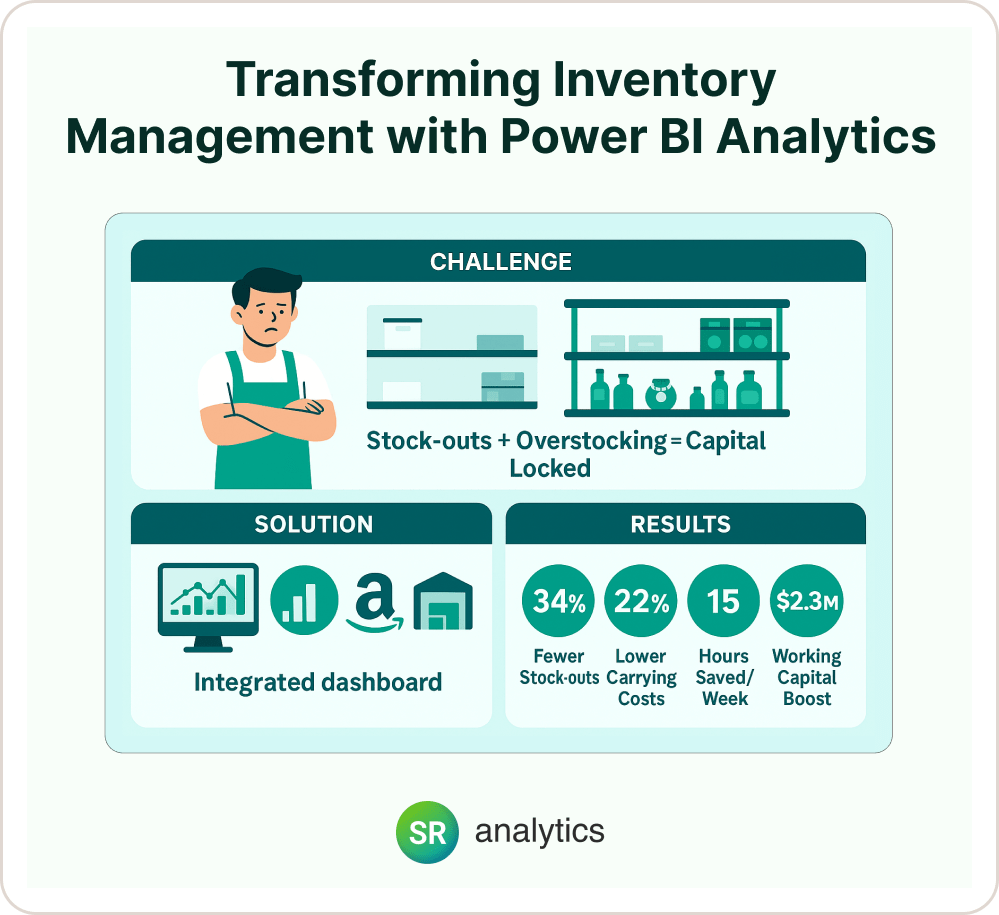
Challenge: A fast-growing jewelry brand struggled with inventory visibility across multiple sales channels. Stock-outs of popular items hurt sales while overstock of slow-movers tied up capital, limiting their ability to realize the full benefits of Power BI data analytics.
Solution: Our team implemented comprehensive Microsoft Power BI dashboards integrating data from Shopify, Amazon, wholesale channels, and internal inventory systems. Real-time visibility through advanced Power BI reporting enabled proactive restocking and identified optimal inventory levels by product category using sophisticated Power BI visualizations.
Results achieved through Microsoft Power BI tools:
- 34% reduction in stock-outs through predictive Power BI analytics
- 22% decrease in carrying costs via automated Power BI dashboards
- 15 hours weekly saved in manual reporting through self-service Power BI features
- $2.3M improvement in working capital efficiency using comprehensive bi analytics
We’ve been able to decrease the workload of almost half an FTE by now having more direct access to reporting. We’re starting to see a reduction in our inventory levels through tighter management.
This transformation illustrates the core benefits of Power BI: turning scattered data into actionable insights through Microsoft Power BI tools that drive measurable business improvements via sophisticated Power BI data analytics.
Conclusion – Embrace the Power of Microsoft Power BI
Microsoft Power BI truly represents a game-changer in business intelligence and bi analytics. By combining intuitive user experience with powerful, enterprise-grade capabilities, Power BI tools deliver both quick wins and long-term strategic value that transforms how organizations operate.
The evidence is compelling: From 270% ROI over three years to 97% of organizations reporting faster decision-making, the benefits of Power BI extend far beyond simple reporting. Whether you’re implementing Power BI dashboards for the first time or optimizing existing Power BI analytics, the platform’s comprehensive Power BI features support businesses at every stage of their data maturity journey.
The data revolution isn’t coming—it’s here. Companies that harness Power BI analytics today will significantly outpace competitors still making decisions based on gut feelings and outdated reports. The question isn’t whether to adopt Microsoft Power BI, but how quickly you can implement it to gain competitive advantage.