Highlight
- Reality Check: 73% of BI implementations fail to deliver ROI within first year – avoid the hype trap
- Market Leaders: Power BI dominates (20%), Tableau (16.4%), Qlik (10%) – but “best” ≠ right for you
- Hidden Costs: That $10/month Power BI can balloon to $100/user with premium features and training
- AI Revolution: Natural language queries now standard – ask questions in plain English, get instant visuals
- Proven ROI: Companies using right BI tools see 5x faster decisions and 27% higher profitability
- Controversial Truth: Most businesses waste money on Tableau when Power BI would solve their problems
Let me start with something that happened to me last year. I was working with a mid-sized retail company that was drowning in spreadsheets. Their marketing team spent hours each week manually compiling sales reports from different systems. Meanwhile, their biggest competitor was making pricing decisions in real-time based on market data.
The difference? The right business intelligence tool.
Fast-forward six months after implementing a proper BI solution, and this company cut its reporting time by 80% while increasing sales by 23%. That’s the power of choosing the right BI tool in today’s data-driven landscape.
But here’s what nobody tells you: 73% of BI implementations fail to deliver expected ROI within the first year. Why? Because companies fall for the marketing hype instead of understanding what they need.
Controversial Take Alert: Most businesses don’t need the “best BI tool” – they need the RIGHT BI tool. I’ve seen companies waste $100K+ on Tableau licenses when a $10/month Power BI subscription would’ve solved their problems perfectly.
AI Overview
The top BI tools in 2025 are Microsoft Power BI (20% market share), Tableau (16.4%), Qlik Sense, ThoughtSpot, and Zoho Analytics, delivering AI-powered insights and self-service analytics. Modern BI platforms feature natural language processing, automated insights, and cloud-native architectures that help businesses make data-driven decisions 5x faster while reducing analysis time by up to 73%.
Top 10 Business Intelligence Tools for 2025
1. Microsoft Power BI – Best Overall BI Platform
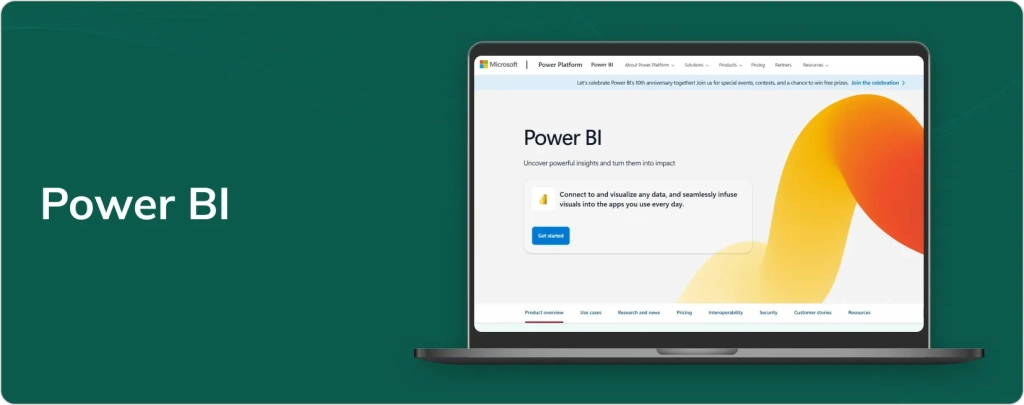
Market Share: 20.06% in business intelligence market
Power BI has earned its position as the market leader through a combination of powerful features, Microsoft ecosystem integration, and competitive pricing. With over 114,814 companies using Power BI globally, it’s become the go-to choice for organizations already invested in Microsoft technologies.
Why Power BI Stands Out:
- Seamless Microsoft Integration: Works natively with Excel, Azure, SharePoint, and Teams
- AI-Powered Copilot: Natural language queries and automated insight generation
- Cost-Effective Pricing: Starting at $10/user/month for the Pro version
- Regular Updates: Monthly feature releases keep the platform cutting-edge
Real-World Example: GlobalTech Solutions implemented Power BI after evaluating 8 different platforms. Their CFO, Sarah Martinez, told me: “We almost went with Tableau because of the hype, but Power BI integrated seamlessly with our existing Microsoft infrastructure. Six months later, we’re analyzing production efficiency in real-time and caught a quality issue that would’ve cost us $2M in recalls.”
This BI tools example demonstrates how the right platform can deliver measurable business impact when aligned with existing infrastructure.
Industry Insight: According to Microsoft’s 2025 Partner Success Report, companies using Power BI within existing Microsoft environments see 340% faster time-to-value compared to greenfield implementations.
Best For: Organizations using Microsoft ecosystem, businesses seeking balance of power and affordability
Website: https://www.microsoft.com/en-us/power-platform/products/power-bi
2. Tableau – Premier Data Visualization Leader
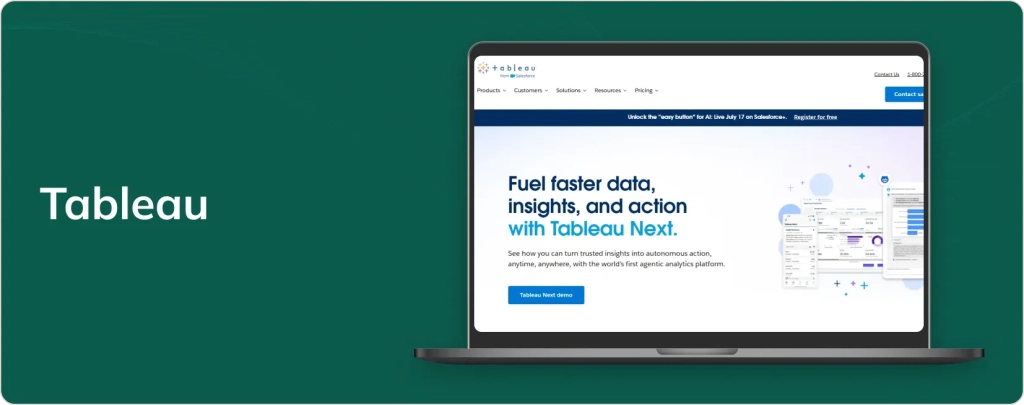
Market Share: 16.37% in business intelligence market
Tableau pioneered modern data visualization and continues setting the standard for beautiful, interactive dashboards. It’s the tool of choice when visualization quality and analytical depth matter most.
Key Strengths:
- Best-in-Class Visualizations: Unmatched chart types and customization options
- Drag-and-Drop Simplicity: Intuitive interface for non-technical users
- Tableau Public: Free version for learning and community sharing
- Strong Community: Extensive resources and user-generated content
Success Story: RetailMax Inc., a mid-market fashion retailer, used Tableau to analyze customer journey data across their 47 stores and e-commerce platform. Their Head of Analytics, James Chen, shared: “Tableau revealed that our mobile users who visited stores within 48 hours had 3x higher lifetime value. This insight led us to redesign our mobile app’s store locator, increasing conversion rates by 28%.”
The Tableau Reality Check: While powerful, expect 3-6 months for full team proficiency and budget $75-150 per user monthly when factoring training and premium features.
Ideal For: Data visualization specialists, organizations prioritizing visual storytelling
Website: https://www.tableau.com/
3. Qlik Sense – AI-Driven Analytics Platform
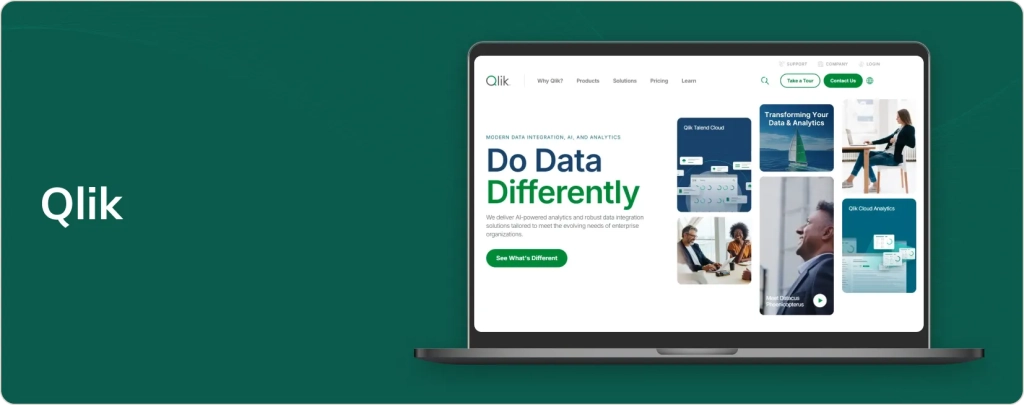
Market Share: 10% in business intelligence market
Qlik Sense combines powerful associative analytics with AI-driven insights, offering unique data exploration capabilities that set it apart from traditional BI tools.
Standout Features:
- Associative Model: Explore data relationships without query limitations
- Insight Advisor: AI assistant that suggests insights and visualizations
- Mobile-First Design: Fully functional mobile apps for on-the-go analytics
- Enterprise Security: Robust governance and access controls
Case Study: A financial services firm used Qlik’s AI insights to identify a previously unknown correlation between customer support interactions and churn risk, reducing customer attrition by 22%. This BI tools example highlights the power of AI-driven analytics.
Perfect For: Large enterprises, organizations needing advanced AI capabilities
Website: https://www.qlik.com/us
4. ThoughtSpot – Conversational Analytics Pioneer
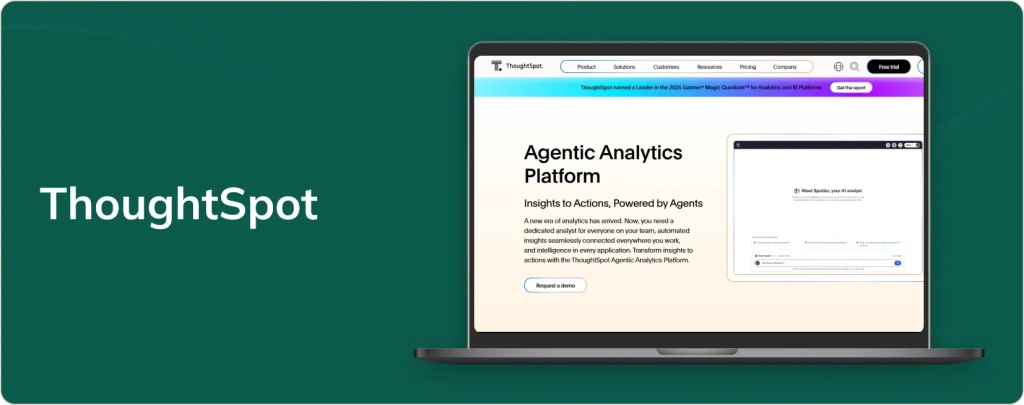
ThoughtSpot revolutionizes how users interact with data through Google-like search functionality and natural language processing. It’s transforming BI from a specialist tool to something anyone can use.
Revolutionary Capabilities:
- Search-Driven Analytics: Type questions in plain English, get instant visualizations
- SpotIQ: AI-powered automated insights and anomaly detection
- Embedded Analytics: Integrate BI directly into business applications
- Real-Time Processing: Handle massive datasets with sub-second response times
Implementation Success: A manufacturing company enabled frontline supervisors to ask questions like “Which production line had the highest defect rate last week?” and get immediate visual answers, reducing quality issues by 35%.
Best For: Organizations prioritizing self-service analytics, embedded BI requirements
Website: https://www.thoughtspot.com/
5. Zoho Analytics – Small Business Champion
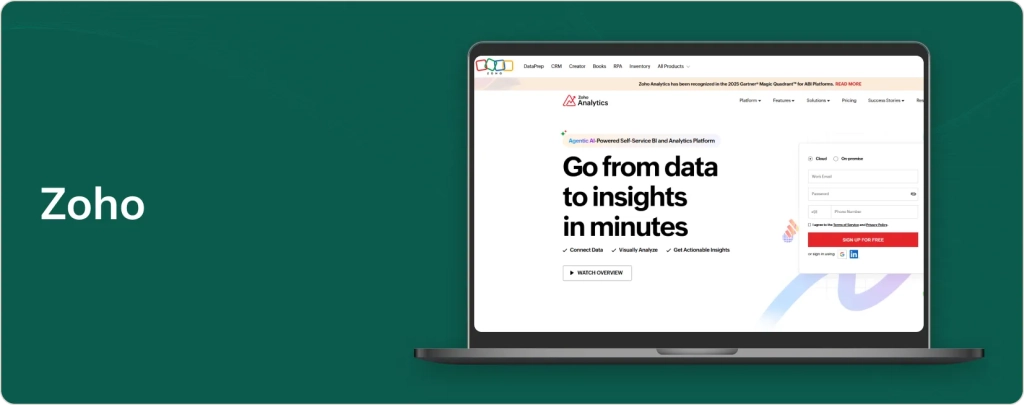
Zoho Analytics delivers enterprise-grade BI capabilities at small business prices, making advanced analytics accessible to organizations with limited budgets.
Value Propositions:
- Affordable Pricing: Plans starting at $24/month with generous free tiers
- User-Friendly Interface: Designed for business users, not technical specialists
- 500+ Integrations: Connect to popular business applications easily
- Ask Zia: AI assistant for natural language queries
Small Business Success: A startup used Zoho Analytics to track marketing funnel performance across multiple channels, optimizing their limited ad budget to achieve 3x return on investment.
Optimal For: Small to medium businesses, budget-conscious organizations
Website: https://www.zoho.com/analytics/
Rising Stars: New BI Tools Nobody’s Talking About
While everyone obsesses over the same old Power BI vs Tableau debate, smart companies are getting competitive advantages from these emerging platforms:
1. Hex – The Data Science Game Changer

What Makes It Different: Hex just raised $70M in Series C funding (May 2025) and is revolutionizing collaborative analytics with notebook-style interfaces that blend SQL, Python, and no-code tools.
Why It Matters: Companies like Notion, Reddit, and Twilio use Hex because it bridges the gap between technical data teams and business stakeholders. Their “notebook to dashboard” approach lets data scientists build analyses that business users can actually interact with.
The Secret Sauce: AI-powered coding assistance and reactive execution that automatically updates downstream analyses when data changes. According to Hex’s leadership, their customers report 60% faster time-to-insight compared to traditional BI tools.
Best For: Companies with strong data science teams who need to democratize insights across the organization.
Website: https://hex.tech/
2. Definite – The All-in-One Startup Champion
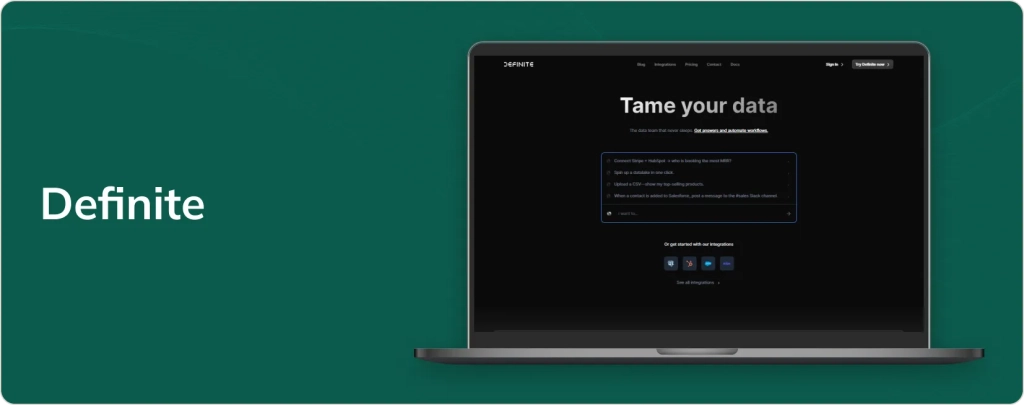
What’s Unique: This under-the-radar platform offers 500+ pre-built integrations with automated data cleaning and a managed data warehouse – all for startup-friendly pricing.
Real Differentiator: Unlike traditional BI tools that require separate ETL processes, Definite handles the entire data pipeline from extraction to visualization in one platform.
Why Startups Love It: No technical team required. Their automated data cleaning and quality monitoring means founders can focus on business decisions instead of data engineering.
Sweet Spot: Early-stage companies (Series A-B) that need enterprise-grade analytics without enterprise complexity or cost.
Website: https://www.definite.app/
3. Databox – The Marketing Analytics Specialist
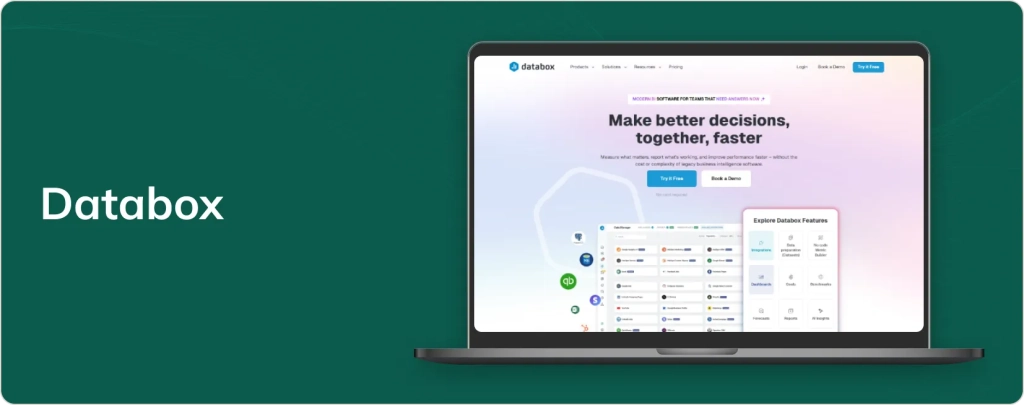
The Angle: While everyone builds general-purpose BI tools, Databox laser-focuses on marketing and sales analytics with 70+ native integrations to marketing tools.
Competitive Edge: Real-time alerts and benchmarking against industry standards. Their 2025 State of Marketing Analytics report shows companies using Databox improve campaign ROI by 34% on average.
Why It’s Winning: Combines the simplicity of marketing dashboards with the power of advanced analytics. Perfect for growth teams who don’t want to learn complex BI tools.
Ideal For: Marketing-driven companies, agencies, SaaS businesses focused on growth metrics.
Website: https://databox.com/
4. Improvado – The Marketing Data Warehouse

Unique Position: Purpose-built for marketing analytics with AI-powered data normalization across 500+ marketing platforms.
The Problem It Solves: Marketing teams waste 40% of their time on data preparation. Improvado’s AI automatically standardizes campaign data from different platforms (Facebook Ads “impressions” = Google Ads “impr.” = TikTok “views”).
Enterprise Traction: Companies like ASUS, Docker, and Indeed use Improvado because it’s the only platform that truly understands marketing data complexity.
Sweet Spot: Mid-market to enterprise companies with complex marketing stacks (5+ advertising platforms).
Website: https://improvado.io/
The Hidden Costs of “Affordable” BI Tools
Here’s what the sales demos don’t show you: that $10/month Power BI license becomes $50-100/month per user when you factor in:
- Premium connector fees
- Additional storage costs
- Training and certification expenses
- Third-party visualization add-ons
Reality Check: I’ve seen Power BI implementations balloon from $2K projected annual cost to $25K actual spend. Always calculate Total Cost of Ownership (TCO), not just license fees.
Why Tableau is Overrated for Most Businesses
Don’t @ me, but I need to say this: Tableau is the iPhone of BI tools – beautiful, powerful, and probably overkill for 70% of users.
Here’s when you DON’T need Tableau:
- Your team has basic visualization needs
- You’re not doing complex statistical analysis
- Budget is a primary concern
- You need quick implementation (Tableau has a steep learning curve)
Tableau shines for data scientists and advanced analysts, but most business users just need clean dashboards and simple drill-downs. According to Forrester’s 2025 BI Wave report, user adoption rates are 40% higher for simpler tools like Power BI compared to Tableau in organizations under 1,000 employees.
Learn more about implementing these trends in our Business Intelligence Strategy Guide.
Industry-Specific BI Tool Recommendations
Healthcare: HIPAA-Compliant Analytics
Top Choice: Tableau with Healthcare Data Models and robust security controls.
Success Story: Regional Medical Center implemented Tableau to track patient outcomes across 12 facilities. Dr. Lisa Park, Chief Medical Officer, reports: “We identified readmission patterns that led to new care protocols, reducing readmissions by 23% while improving patient satisfaction scores.”
Compliance Note: Ensure BAA (Business Associate Agreement) with any BI vendor handling PHI data.
Retail: Real-Time Inventory & Customer Insights
Top Choice: ThoughtSpot for instant answers to retail questions like “Which stores have the highest margin products in low inventory?”
Real Impact: FashionForward Retail uses ThoughtSpot’s search-driven analytics. Store managers can ask natural language questions and get instant inventory insights, improving stock availability by 35%.
Budget Alternative: Power BI with Retail Analytics templates from Microsoft AppSource.
Industry Expert Insight
“The BI landscape in 2025 is defined by accessibility and intelligence. Top BI tools that combine powerful analytics with intuitive interfaces will dominate, while AI-driven insights become table stakes rather than differentiators.” – Gartner Magic Quadrant for Analytics and Business Intelligence Platforms
BI data storytelling framework and crowns Microsoft Power BI as today’s analytics “king,” while spotlighting new contenders and emerging trends in business intelligence.
Common BI Implementation Mistakes (And How to Avoid Them)
After helping dozens of companies select and implement BI tools, I’ve seen the same mistakes repeatedly. Here’s what to watch out for:
Mistake #1: Technology-First Approach
The Problem: Companies get excited about AI features and fancy visualizations before understanding their actual requirements.
The Fix: Start with business questions, not technical capabilities. What decisions do you need to make faster? What insights are currently missing?
Mistake #2: Underestimating Change Management
The Reality: Harvard Business Review research shows that 70% of BI projects fail due to user adoption issues, not technical problems.
The Solution: Invest heavily in training and change management. Many organizations find that partnering with experienced business intelligence services providers accelerates both technical implementation and user adoption.
Mistake #3: Ignoring Data Quality
The Truth: Garbage in, garbage out. Even the most sophisticated top BI tools can’t fix fundamental data quality issues.
The Prevention: Establish data governance before tool selection. Clean, consistent data makes any BI platform more effective.
The Future of Business Intelligence (What’s Really Coming)
Prediction 1: Conversational Analytics Becomes Standard
By 2026, every BI tool will offer natural language queries. The differentiator will be accuracy and context understanding, not just keyword matching.
Prediction 2: Embedded Analytics Kills Standalone BI
Why switch to a separate tool when analytics live inside your CRM, ERP, or custom application? Expect more acquisitions of BI companies by software vendors.
Prediction 3: AI Removes the Need for Dashboard Design
Future BI tools will automatically generate optimal visualizations based on user intent and data characteristics. Manual chart selection will feel as outdated as coding HTML by hand.
For comprehensive guidance on avoiding these pitfalls, refer to our detailed analysis in what is business intelligence, which covers foundational concepts that ensure BI success.
Conclusion: Your Path to Data-Driven Success
The right BI tool transforms how organizations operate, compete, and grow. Whether you choose Power BI’s comprehensive Microsoft integration, Tableau’s visualization excellence, or ThoughtSpot’s conversational analytics, the key is selecting a platform that aligns with your specific needs and organizational culture.
Remember: successful BI implementation isn’t just about the technology – it’s about creating a data-driven culture where insights inform every decision. The organizations winning in 2025 aren’t necessarily those with the most sophisticated top BI tools, but those that most effectively turn data into action through strategic BI and analytics implementation.


