Highlights
- Explosive market growth: Global BI market reached $47.48B in 2025, projected $151.26B by 2034 at 13.74% CAGR (Precedence Research)
- Cloud adoption surge: 75% of organizations use cloud BI solutions, up from 45% in 2021 (Gartner)
- Measurable productivity gains: BI analytics reduce manual reporting time by 60-80%, freeing 0.5 FTE per team
- Strong ROI evidence: Financial institutions save 120+ hours monthly in reporting after BI implementation
- Decision-making advantage: CEOs using data-driven decisions are 77% more likely to succeed (Deloitte)
- AI integration acceleration: 40% of new BI deployments in 2025 will be AI-powered augmented analytics (Gartner)
I’ll never forget the moment I realized we were drowning in data but starving for insights.
Our team had just spent three weeks manually piecing together why a major product launch underperformed. We had spreadsheets everywhere. Sales data lived in one system, inventory logs in another, customer feedback scattered across email threads. By the time we figured out what went wrong, the opportunity to fix it had passed.
That’s when business intelligence clicked for me. Having data isn’t enough. You need BI tools that actually help you use it.
This guide covers what business intelligence is in 2025, how BI analytics platforms transform decision-making, and real strategies organizations use to achieve 60-80% time savings with measurable ROI.
Quick Answer:
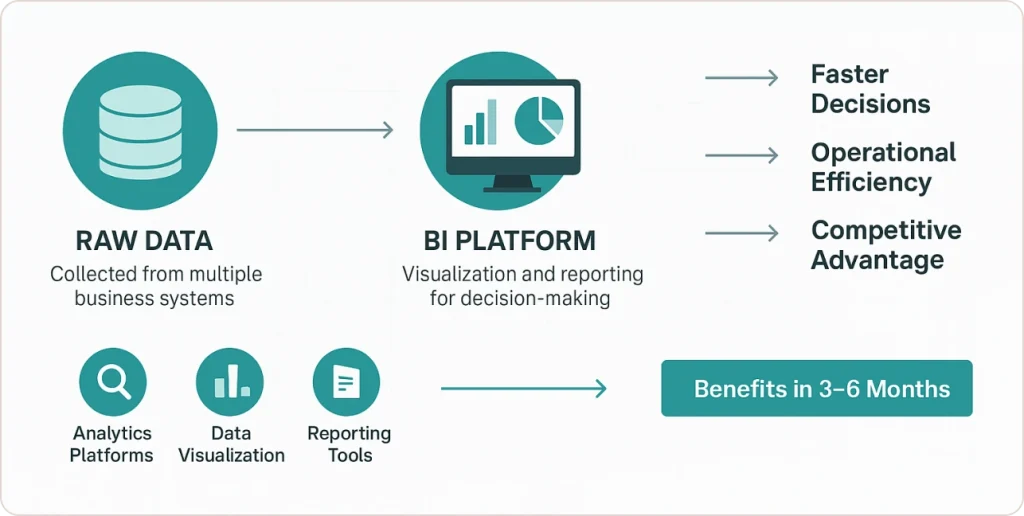
Business intelligence (BI) transforms raw data into actionable insights through analytics platforms, data visualization, and reporting tools, enabling organizations to make faster, data-driven decisions that improve operational efficiency and competitive advantage.
Understanding Business Intelligence: More Than Just Reports
“The goal of business intelligence is to turn data into information, and information into insight.” — Carly Fiorina, Former CEO of HP Source: BI Industry Insights
Business intelligence is the technology-driven process of analyzing business data and presenting actionable insights to help you make informed decisions. Unlike basic reporting that tells you what happened, BI intelligence combines data analytics, visualization tools, and predictive modeling to answer why it happened and what you should do next.
Think of BI for business as your organization’s nervous system. Just as your nervous system collects signals from throughout your body and helps your brain make split-second decisions, a business intelligence solution gathers data from every corner of your operation and delivers insights exactly when you need them.
The global business intelligence market reached $47.48 billion in 2025 and is projected to hit $151.26 billion by 2034 at 13.74% CAGR, according to Precedence Research, reflecting how essential these tools have become for competitive advantage. This explosive growth tells me one thing: organizations that embrace BI analytics are winning, and those that don’t are falling behind.
The Core Components of Business Intelligence Systems
A comprehensive business intelligence solution consists of five essential layers that work together seamlessly. Understanding these components helps you evaluate tools for business intelligence and build systems that actually solve your problems.
Data warehousing forms the foundation. This centralized repository consolidates information from disparate sources into a single, unified structure. Instead of jumping between systems, your team accesses one authoritative version of the truth. Modern data warehouses handle both structured data like transactional records and semi-structured data like JSON logs from web applications.
Data mining and analytics represent the intelligence layer. Advanced algorithms identify correlations, trends, and anomalies that humans might miss. Machine learning models can predict customer churn before it happens, forecast demand with remarkable accuracy, and flag unusual patterns that indicate fraud or operational issues.
Visualization and reporting transform complex datasets into intuitive dashboards and interactive charts. The best BI analytics tools let non-technical users explore data themselves without writing SQL queries or waiting for IT support. This self-service capability democratizes data access across your organization.
Performance management capabilities track KPIs against targets, sending alerts when metrics deviate from expected ranges. Executives see real-time scorecards showing progress toward strategic goals, while operational managers monitor daily metrics that drive front-line performance.
Collaboration features enable teams to share insights, annotate findings, and build collective understanding. When your sales director discovers an interesting pattern in regional performance, they can instantly share that dashboard with the executive team complete with contextual notes.
How Business Intelligence Drives Measurable Results
The benefits of BI extend far beyond prettier reports. Organizations implementing comprehensive bi intelligence systems consistently achieve quantifiable improvements across multiple dimensions.
Accelerated decision-making stands out as the most immediate impact. Companies with CEOs making data-driven decisions are 77% more likely to succeed, according to Deloitte research. Instead of waiting days for custom reports, business users answer their own questions in minutes.
Cost optimization through BI analytics delivers rapid ROI. I’ve seen this firsthand with our clients. Awe Inspired, a fine jewelry brand, reduced their manual reporting workload from 20+ hours weekly to just 4 hours after implementing automated Power BI dashboards. That’s an 80% time savings. Their COO Tim Eisenmann told us they decreased inventory carrying costs through tighter management enabled by real-time visibility.
A financial institution saved 120 hours in monthly reporting processes after implementing BI solutions, translating into substantial annual labor savings. These aren’t hypothetical benefits. They’re measurable improvements that directly impact your bottom line.
Revenue growth opportunities become visible through sophisticated bi for business analytics. Retail chains use BI to identify which product combinations customers buy together, optimizing store layouts and promotional strategies. Financial services firms leverage predictive analytics to identify high-value prospects most likely to convert, improving marketing efficiency by 15-25%.
Risk mitigation capabilities protect your business from threats you might otherwise miss. Fraud detection systems powered by bi analytics analyze millions of transactions in real-time, flagging suspicious patterns for investigation. Supply chain dashboards identify potential disruptions before they impact production.
Choosing the Right Business Intelligence Tools
The BI market offers dozens of business intelligence solutions, each with distinct strengths.
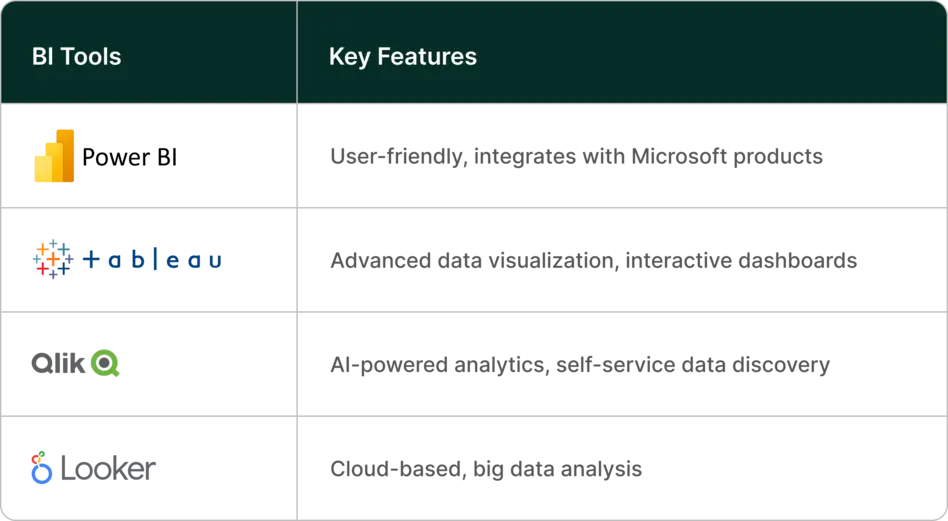
Microsoft Power BI dominates the mid-market with its combination of affordability, ease of use, and deep integration with Microsoft’s ecosystem. At $10 per user monthly, it delivers enterprise capabilities at SME-friendly pricing.
Tableau excels at data visualization and exploratory analytics. Its intuitive visual interface lets users discover insights through interactive exploration rather than predefined reports. Organizations prioritizing visual storytelling favor Tableau. Compare detailed differences in our Power BI vs Tableau analysis.
Qlik Sense differentiates itself through associative analytics where users can click any data point to see related information across all dimensions instantly. This approach reveals connections that traditional query-based tools might miss.
Looker takes a unique approach by defining business logic in a modeling layer that ensures consistency across all reports and dashboards. Owned by Google Cloud, Looker integrates deeply with BigQuery and other cloud data platforms. This “single source of truth” architecture prevents the data definition conflicts that plague many organizations.
When evaluating business intelligence and analytics platforms, assess integration capabilities with your existing systems first. The best BI tool becomes useless if it can’t connect to your data. Second, evaluate the learning curve and whether your team can become proficient without extensive training. For comprehensive guidance on selecting BI platforms, explore our top BI tools comparison.
Real-World Business Intelligence Success Stories
Abstract benefits sound nice, but concrete examples demonstrate BI’s transformative potential. Here are verified case studies from our client work demonstrating measurable business intelligence ROI.
Precise Imaging: This medical imaging provider faced scheduling inefficiencies that led to frequent patient no-shows and underutilized equipment. We implemented custom Power BI dashboards providing real-time visibility into billing, scheduling, and operations. The business intelligence solution helped reduce no-shows and improve decision-making across all operational areas. Their team called our work “responsive, technically sharp, and truly understood business needs.” (Source)
Awe Inspired: With 40% year-over-year growth, this jewelry brand faced operational complexity with rapidly expanding SKU counts tying up capital. We integrated data from Shopify, Cin7, Airtable, Excel, and Google Sheets into a centralized Google BigQuery warehouse with Power BI reporting. The automated reporting reduced manual workload by nearly half an FTE. Enhanced visibility enabled strategic inventory positioning and merchandising decisions that immediately impacted the bottom line.(Source)
Pinnacle Fund Services: This fund management firm needed consolidated KPI views across investment portfolios, asset allocations, and investor performance metrics. We developed comprehensive Power BI dashboards emphasizing speed, navigation ease, and high-value insights. The bi intelligence platform delivered over 15 detailed reports with 20+ powerful metrics, enabling Pinnacle to enhance service offerings with detailed, actionable investment insights.(Source)
Getting Started with Business Intelligence: Your Roadmap
Implementing BI successfully requires more than buying software. Follow this structured approach to maximize your chances of success.
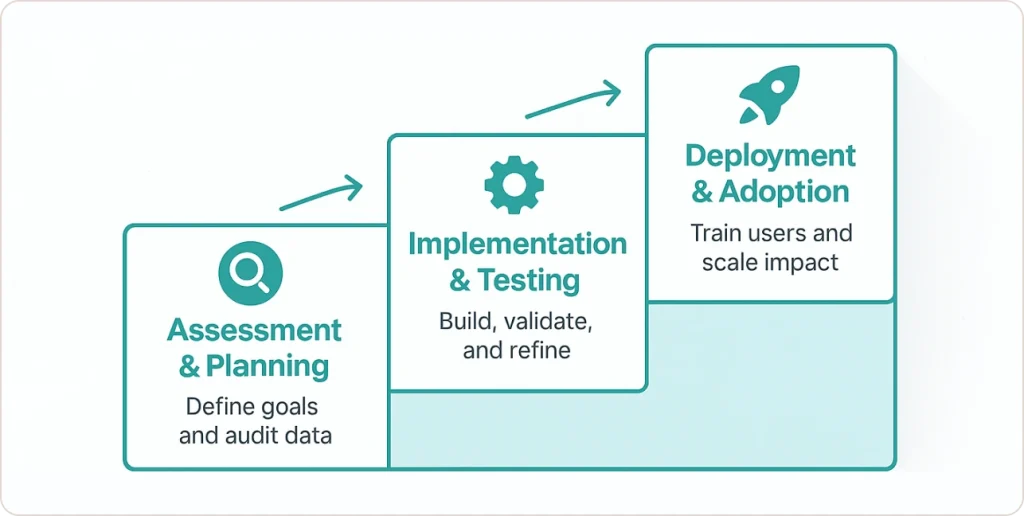
Phase 1: Assessment and Planning
Begin by identifying your most pressing business questions. What decisions would you make differently with better information? Which processes consume excessive manual effort? Document specific use cases with measurable success criteria.
Audit your current data landscape honestly. Catalog all source systems, assess data quality, identify integration challenges. Discovering data quality issues during planning beats encountering them during implementation.
Phase 2: Implementation and Testing
Build iteratively rather than attempting big-bang delivery. Start with a minimum viable product covering your priority use cases. Test thoroughly with real users in realistic scenarios.
Establish data quality controls at the source. Automated validation rules catch errors before they reach your business intelligence solution. For organizations migrating from spreadsheets, our Excel to Power BI migration guide provides step-by-step conversion strategies.
Phase 3: Deployment and Adoption
Launch to a pilot group before full rollout. Champion users provide valuable feedback and become advocates who help others during wider deployment.
Create support resources including quick reference guides, video tutorials, and regular office hours. Make help easily accessible. If users struggle, they’ll revert to old habits.
The Future of Business Intelligence and Analytics
BI continues evolving rapidly. Understanding emerging trends helps you future-proof your investments.
By 2025, AI-powered augmented analytics will be a dominant driver of new purchases, reaching 40% of new deployments. Modern platforms use machine learning to automatically identify anomalies, generate natural language insights, and recommend optimal actions. Explore how AI-powered data storytelling dashboards are changing decision-making.
Embedded analytics brings insights directly into operational workflows. Rather than switching to a separate BI tool, users see relevant analytics embedded in the applications they use daily. Your CRM shows predictive lead scores, your ERP highlights inventory risks, your marketing platform suggests optimal send times.
By 2024, 75% of organizations will rely on business intelligence solutions delivered through the cloud, reflecting the shift from on-premise to cloud-based deployment. This transition enables real-time insights, automatic scaling, and reduced infrastructure costs.
Data democratization accelerates as tools become more intuitive. Natural language queries let business users ask questions in plain English. Automated data preparation eliminates technical barriers. Learn more about emerging business intelligence and analytics trends for 2025.
Conclusion: Transform Data Into Your Competitive Advantage
Business intelligence has evolved from a luxury for large enterprises to a necessity for organizations of any size competing in data-rich markets. The question isn’t whether you need BI analytics. It’s how quickly you can implement solutions that turn your data into decisions, insights into actions, and information into competitive advantage.
The global business intelligence market’s rapid growth to $47.48 billion in 2025 reflects a fundamental shift in how successful organizations operate. They don’t just collect data. They extract meaning. They don’t just generate reports. They enable insights. They don’t just analyze the past. They anticipate the future.
Your competitors are already investing in business intelligence and analytics. The performance gap between data-driven organizations and those relying on intuition widens daily. Starting your BI journey isn’t about keeping pace. It’s about survival.
The good news? You don’t need to transform everything overnight. Start with focused use cases that address real pain points. Demonstrate value quickly. Build momentum. Expand thoughtfully. Organizations that follow this path consistently achieve meaningful ROI within quarters, not years.