Ever feel like the big players have all the data advantages? Not anymore.
In today’s business battlefield, staying ahead of BI trends isn’t just for enterprise giants with massive budgets. Your mid-sized company can leverage the same powerful business intelligence tools to compete and win.
The right data analytics approach can transform how you make decisions, serve customers, and grow revenue.
Here’s something that might surprise you: the global BI market is projected to grow from USD 36.82 billion in 2025 to USD 116.25 billion by 2033, at a CAGR of 14.98% during the forecast period. But which of these shiny new trends actually matter for your business?

I’ve cut through the hype to bring you the 10 business intelligence and analytics trends for 2025 that mid-sized companies can actually use. No enterprise-level resources required — just practical strategies you can implement starting today.
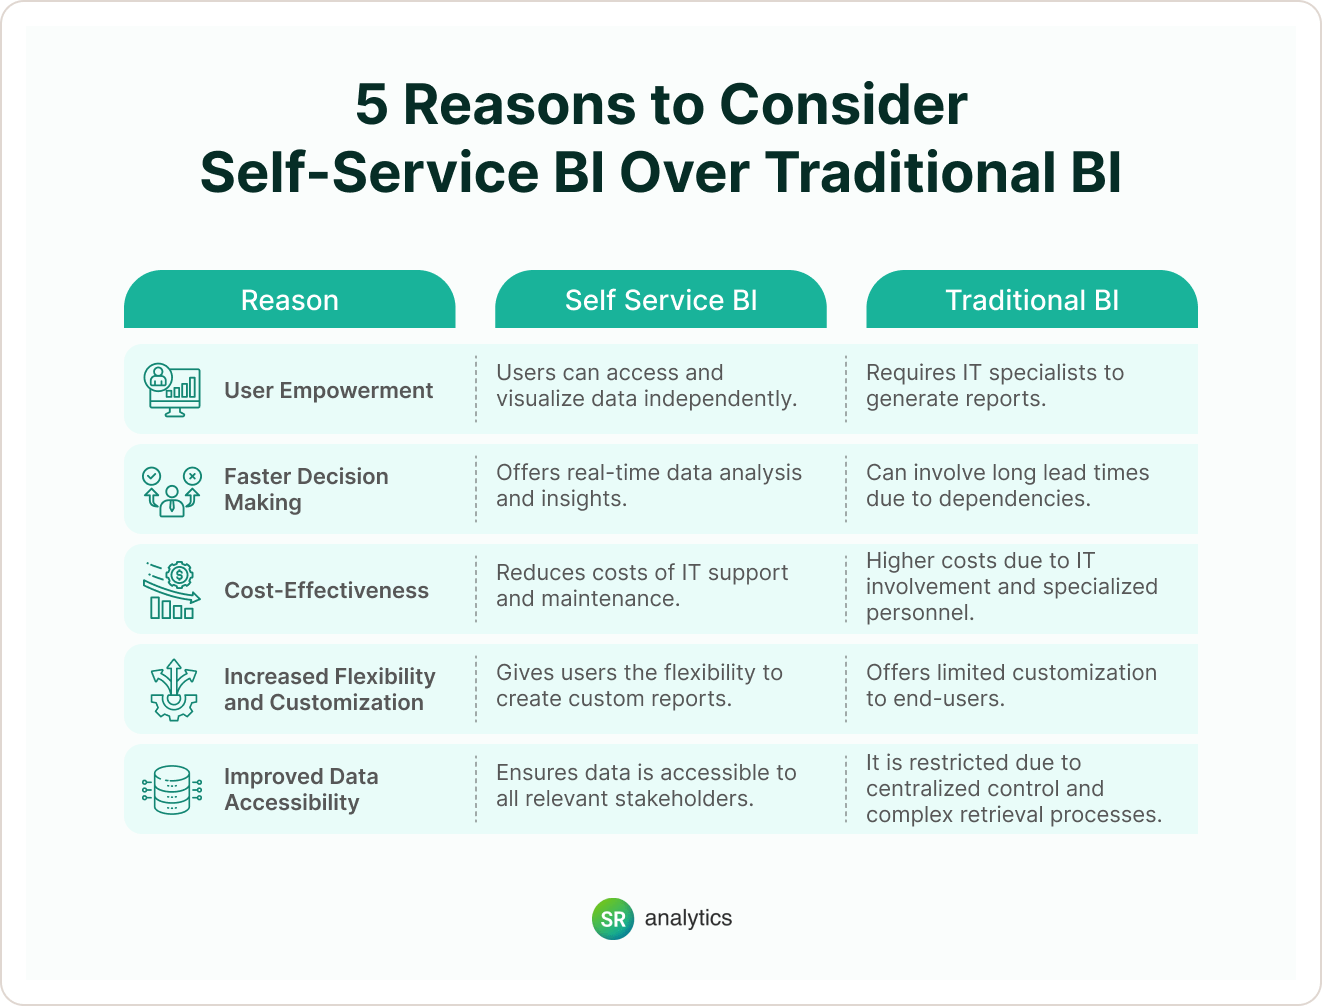
1. Self-Service BI: When Everyone Becomes a Data Analyst
Remember when you needed a technical translator just to get basic data insights? Those days are officially over.
Self-service business intelligence has transformed from luxury to necessity in 2025. Your marketing manager can now create custom sales territory reports without filing an IT ticket. Your operations lead can build supply chain visualizations during her morning coffee. This isn’t just convenient — it’s revolutionary.
Why does this matter for your mid-sized business? Because you’re already asking your team to wear multiple hats. Self-service BI means everyone from executives to frontline managers can access, analyze, and act on data instantly.
No more waiting days for reports or making decisions based on gut feelings because the numbers are locked away.
According to Accenture’s research, only about 32% of business executives say they’re able to create measurable value from data, and just 27% report that their analytics projects produce actionable insights.
The gap is even more striking when we learn that only 6% of companies have achieved a mature, insights-driven culture.
How to implement this today:
- Choose tools designed for humans, not data scientists — Power BI and Tableau lead the pack for user-friendly interfaces
- Start small: identify 2-3 high-impact reports your teams request frequently and convert them to self-service dashboards
- Provide basic training through lunch-and-learns — even 30 minutes can transform how comfortable non-technical staff feel with data
2. Data Governance: The Unsexy Trend That Could Save Your Business
Let’s face it—data governance sounds about as exciting as filing taxes. But here’s the reality: it’s consistently ranked as the #1 priority among BI professionals in 2025 for good reason.
Think of it this way: you wouldn’t hand out keys to your office to random people on the street. So why would you give unrestricted access to your company’s most valuable asset—its data?
You’re in a tricky spot as a mid-sized business. You handle enough sensitive data to attract regulatory attention (and hefty fines), but probably don’t have the luxury of a dedicated compliance team like enterprise companies do. One data breach could cost you millions in damages and lost customer trust.
The good news? Modern BI platforms now bake governance right into their systems. Features that were once enterprise-exclusive—role-based access controls, automated compliance monitoring, data catalogs—are now available to businesses your size.
According to BARC’s BI Trend Monitor Survey, data security/privacy, data quality management, and data governance rank as the top three BI trends for 2025 among practitioners. This underscores the critical importance of getting your data house in order.
Make this work for you:
- Start with a simple one-page data governance policy that answers: Who can access what data? Under what circumstances? For what purposes?
- Designate a “data guardian” (even part-time) who owns security and compliance
- If you’re short on expertise, consider a quick engagement with business intelligence consulting services to establish your governance foundation—often completable in just 2-3 weeks
3. Data Quality: Why Your Brilliant Analytics Strategy Is Failing
You’ve invested in cutting-edge analytics tools. Your team has built beautiful dashboards. But somehow, your data-driven decisions aren’t delivering results. Sound familiar?
The culprit is probably hiding in plain sight: poor data quality. The “garbage in, garbage out” principle has never been more relevant than in 2025. Even the most sophisticated AI can’t turn bad data into good insights.
- Multiple systems that don’t talk to each other
- Inconsistent data entry from different teams
- Limited resources for proper data cleaning
Yet fixing data quality issues delivers one of the highest ROIs in the entire BI universe. When leaders trust the numbers, they actually use them to make decisions. When customers receive accurate information, they trust your brand more.
Harvard Business Review research found that companies with high-quality data can attribute it to measurable increases in revenue and significant reductions in operational costs.
The silver lining? Data quality tools have become dramatically more accessible. Features that once required specialized software—automated profiling, anomaly detection, standardization—now come standard in many BI platforms.
Quick wins for better data quality:
- Conduct a “data quality audit” on your most business-critical reports—are the numbers accurate? If not, trace back to why
- Implement validation rules at data entry points (like your CRM) to prevent bad data from entering in the first place
- Create a simple data dictionary so everyone in your organization uses the same definitions
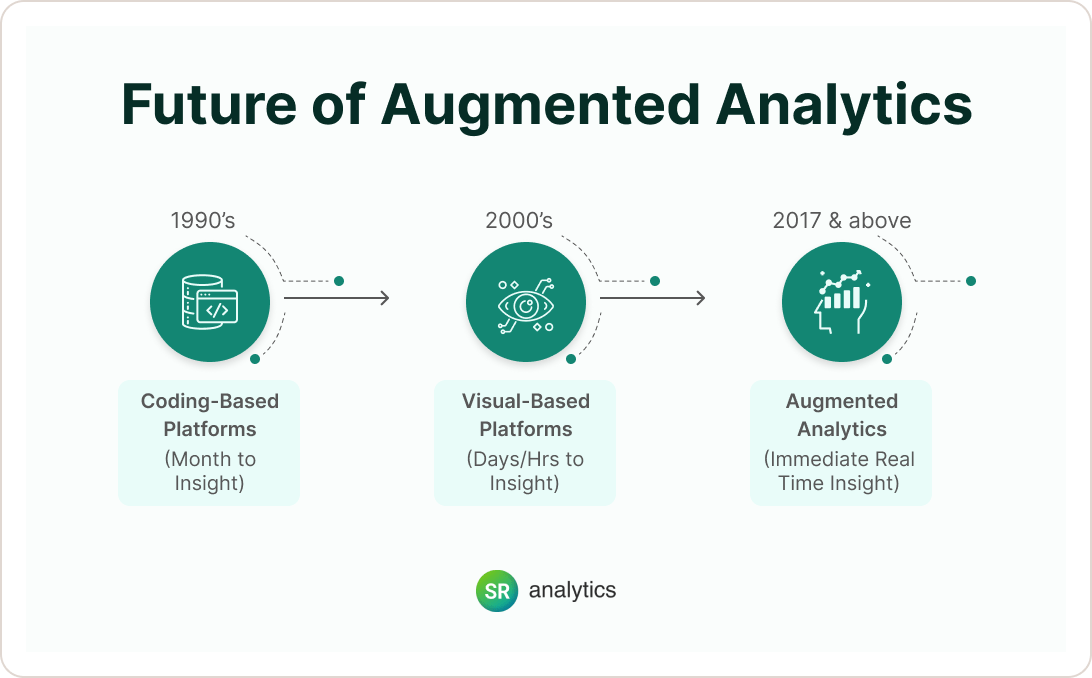
4. Augmented Analytics: Your AI Data Sidekick Has Arrived

Remember when “AI in analytics” was just a buzzword that meant “slightly smarter filters”? In 2025, it’s actually delivering on its promise—and mid-sized businesses stand to benefit the most.
Augmented analytics is like having a data scientist working 24/7 alongside your team. It automatically spots patterns, anomalies, and opportunities that would take your staff days to discover manually—if they found them at all.
- Your BI dashboard automatically flags that return rates spiked 15% for a specific product last Tuesday
- Your sales forecasts update automatically, with explanations of which factors are influencing the predictions
- Complex data stories get translated into plain English: “Revenue increased 8% primarily due to higher conversion rates in the Southeast region”
The best part for mid-sized companies? You get enterprise-grade insights without hiring an expensive data science team. One analyst with AI-powered tools can now do the work that used to require an entire department.
The adoption of AI in analytics is well underway, with nearly 65% of organizations having already adopted or actively exploring AI technologies for data analytics as of 2024.
Companies using AI-driven predictive analytics report a 20-30% improvement in decision accuracy on average, according to ThoughtSpot’s AI in Analytics research.
How to bring AI into your analytics today:
- Check if your current BI platform already offers augmented analytics features—many companies don’t realize what capabilities they already have
- Start with a focused high-value use case (like inventory forecasting or customer churn prediction) rather than trying to AI-enable everything at once
- Look for tools that explain their AI recommendations in plain language, not black-box solutions
5. Conversational Analytics: “Hey Data, What Were Our Q2 Sales?”
Imagine your CEO walking into a meeting, asking her phone “What were our top-performing products last month compared to forecast?” and instantly getting a beautiful visualization with the answer. That’s not science fiction—it’s business intelligence in 2025.
Natural language processing (NLP) has revolutionized how we interact with data. The days of learning complex query languages or navigating maze-like interfaces are over. Your team can now talk to your data like they’d talk to a knowledgeable colleague.
- Executives get instant answers without pinging analysts or waiting for reports
- Field teams can pull data while at client sites without technical expertise
- New employees become data-proficient in days instead of months
- Your limited analyst resources can focus on complex problems instead of basic reporting
The accuracy of these conversational systems has improved dramatically. In 2025, they understand context, business terminology, and even industry-specific jargon that would have confused earlier systems.
Modern BI tools now offer features like Microsoft Power BI’s Q&A, Tableau’s Ask Data, and even more cutting-edge, vendors are integrating large language models (LLMs) into analytics—Microsoft’s Copilot for Power BI uses generative AI to help create reports and insights via chat, and Salesforce has unveiled Tableau GPT to automatically generate explanations from data.
Try this today:
- Ask your BI vendor about their NLP capabilities—many platforms have added these features but don’t highlight them
- Create a “question library” with 15-20 common business questions your teams frequently ask
- Ensure your data has clear, consistent naming conventions—”SalesQ1″ is more NLP-friendly than “s_q1_rev”
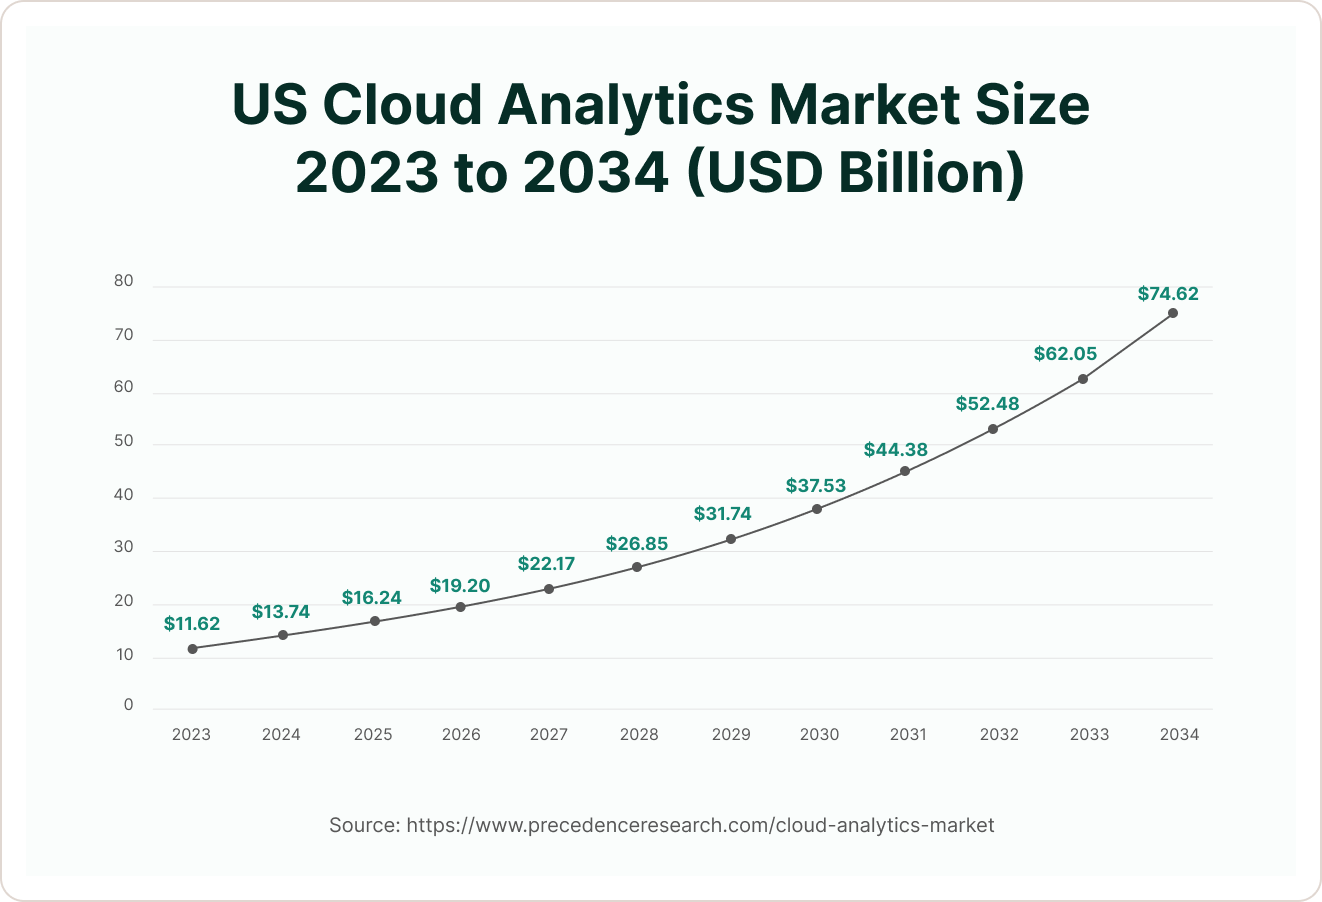
6. Cloud BI: Why On-Premises Analytics Is Going Extinct

Still running your business intelligence on local servers? You’re officially in the minority in 2025.
Cloud-based BI has moved from “growing trend” to “standard operating procedure” for good reason. For mid-sized businesses especially, the benefits are too compelling to ignore:
- Cost efficiency: Pay for what you use instead of massive upfront hardware investments
- Automatic updates: New features appear without your IT team lifting a finger
- Infinite scalability: Need to analyze 10x more data suddenly? Just adjust your subscription
- Work-from-anywhere access: Your team expects dashboards on their phones, tablets, and laptops whether they’re in the office, at home, or on the road
Here’s what might surprise you: cloud BI security has actually surpassed what most mid-sized businesses could implement on-premises. Cloud providers invest millions in security measures most companies couldn’t afford independently.
One mid-sized manufacturing client told me they reduced their BI infrastructure costs by 62% while doubling the number of users after moving to a cloud platform. The IT team that once spent 15 hours weekly managing servers now focuses on creating business-driving insights instead.
According to SAP’s research, Gartner predicts that by 2026, 75% of organizations will have adopted a cloud-first data strategy for analytics and beyond. Industry analysis shows that the percentage of enterprise applications running on traditional on-premise servers plummeted from about 50% in 2019 to just 32% by 2022, as workloads shifted to the cloud.
Making the move:
- Inventory your current reporting environment—what’s business-critical vs. nice-to-have?
- Explore BI-as-a-Service options where providers handle the entire implementation
- Create a phased migration plan starting with non-sensitive data
- Don’t forget to verify that any solution meets your industry’s compliance requirements
7. Data Storytelling: Because Numbers Alone Don’t Change Minds
We’ve all been there—presenting a data-packed dashboard only to watch eyes glaze over. The harsh truth? Numbers alone rarely drive action, no matter how compelling they are.
That’s why data storytelling has become the essential companion to visualization in 2025. It’s no longer enough to show what happened; you need to explain why it matters and what should happen next.
- 2015: “Here’s a bar chart showing sales declined 12% in Q3.”
- 2020: “Here’s an interactive dashboard showing sales trends by region.”
- 2025: “Here’s how supply chain disruptions in Asia drove a 12% sales decline in Q3, primarily affecting our enterprise segment. Based on historical patterns, we should increase inventory of these three products before Q4.”
For mid-sized businesses without dedicated data journalists, this trend offers particular value. Modern BI tools now include features that automatically generate narratives alongside visualizations—explaining anomalies, highlighting key drivers, and even suggesting next steps.
According to TechTarget, Gartner predicted that by 2025, data storytelling will be the most widespread way of consuming analytics, and that 75% of these stories will be automatically generated using augmented analytics techniques. We’re seeing this play out as modern BI tools provide narrative explanations, and AI can even auto-generate written insights.
A retail client recently told me their executive meetings are 30% shorter since implementing data storytelling. “We spend less time debating what the numbers mean and more time deciding what to do about them,” their COO explained.
How to tell better data stories:
- Add context to every dashboard—what was the goal? What happened? Why does it matter?
- Use annotations to highlight key points directly on visualizations
- Create a template for data presentations: Situation → Complication → Question → Answer → Action
- Take advantage of automated narrative generation in tools like Power BI’s Smart Narrative, Tableau’s Explain Data, and Qlik’s Insight Advisor
8. Collaborative BI: Breaking Down the Last Data Silos
Ever played the corporate version of “telephone”? Marketing has one version of customer data, sales has another, and by the time it reaches the executive team, it’s transformed into something unrecognizable.
In 2025, collaborative BI is ending this game for good. Think of it as Google Docs for your analytics—teams can now work together on the same dashboards in real-time, comment directly on data points, and share insights without creating disconnected exports.
- When sales notices an unusual trend, they can tag the product team directly in the dashboard
- When a key metric changes dramatically, automated alerts notify relevant teams instantly in Slack or Teams
- Everyone from the CEO to frontline managers sees the exact same numbers—a true “single source of truth”
For mid-sized businesses, this solves a critical problem. When team members wear multiple hats, they can’t afford to waste time reconciling conflicting reports or hunting for the latest data. Collaborative BI creates a shared data environment that speeds up decision-making across departments.
A verified Harvard Business Review study found that organizations with collaborative analytics environments make decisions significantly faster than those operating in data silos.
One technology company I work with reduced their weekly reporting time from 12 hours to 2 hours after implementing collaborative BI features. “We stopped creating static reports for every meeting and just started sharing live dashboard links with comments,” their head of operations explained.
Try these collaborative approaches:
- Identify your “data hoarders” and work to bring their valuable insights into shared platforms
- Create a central data hub where employees can find all important dashboards in one place
- Schedule regular “data standups” where teams discuss key metrics together
- Replace static weekly reports with live, collaborative dashboards when possible
9. BI as a Service: Analytics Expertise On-Demand

Tried to hire a data analyst lately? Then you know the struggle is real.
The talent shortage in analytics has only intensified in 2025, with qualified professionals commanding salaries that can strain mid-sized business budgets. That’s why many companies are turning to a more flexible approach: Business Intelligence as a Service (BIaaS).
- Need a complete BI implementation? They’ll build it.
- Need a specific dashboard for an upcoming board meeting? They’ll create it.
- Need someone to optimize your existing reports? They’ll improve them.
The BIaaS model ranges from fully-managed cloud platforms to fractional data analysts who work with your team part-time. This flexibility is perfect for mid-sized businesses that need enterprise-grade analytics but can’t justify hiring a full team of specialists.
According to Gartner’s verified IT spending research, the “analytics-as-a-service” market is growing at over 20% annually, significantly outpacing traditional analytics software growth.
A healthcare client recently told me they saved over $200,000 annually by using BI consulting services instead of hiring three specialized roles. They also completed their analytics transformation in 4 months instead of the 12+ months typically needed to hire and train a team.
Try these collaborative approaches:
- Identify your “data hoarders” and work to bring their valuable insights into shared platforms
- Create a central data hub where employees can find all important dashboards in one place
- Schedule regular “data standups” where teams discuss key metrics together
- Replace static weekly reports with live, collaborative dashboards when possible
Is BIaaS right for you?
- Calculate the true cost of in-house analytics (salaries, benefits, training, turnover)
- Identify your most pressing analytics needs—would external expertise solve them faster?
- Consider a hybrid approach: use BI consulting services for implementation and complex projects while building core internal capabilities
- Look for partners with proven experience in your specific industry
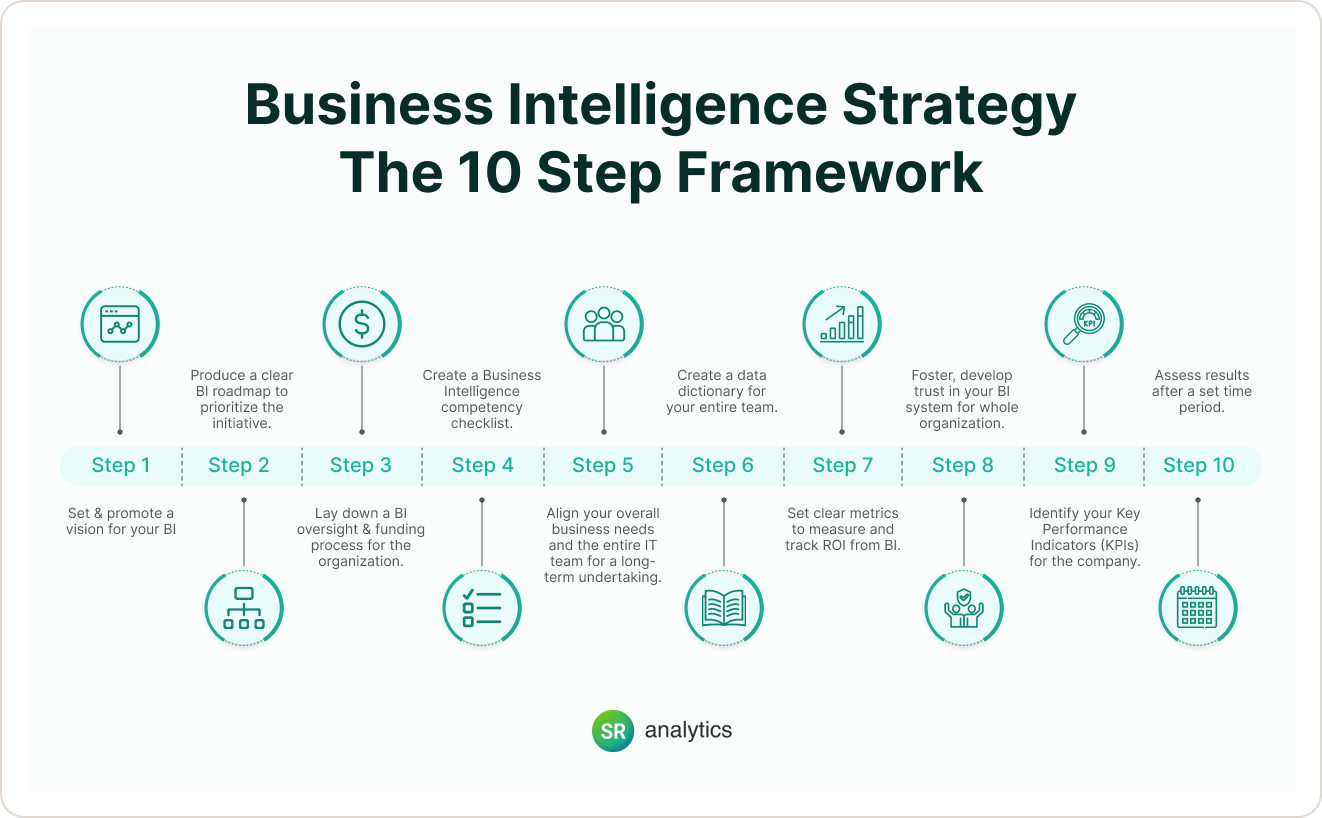
10. Business Intelligence Strategy: Connecting the Dots

Let’s be honest: jumping on every shiny new BI trend is a recipe for wasted resources. The real game-changer in 2025 isn’t any single technology—it’s having a comprehensive business intelligence strategy that ties everything together.
The most successful mid-sized businesses have moved beyond the “random acts of analytics” approach. Instead, they’re creating structured roadmaps that align their data initiatives with specific business outcomes:
- Which customer segments should we focus on? (data answers this)
- Where are our operational bottlenecks? (data reveals this)
- What product innovations will drive growth? (data predicts this)
A well-crafted BI strategy ensures you’re not just collecting data for its own sake, but actively using it to fuel decisions that impact your bottom line.
Studies consistently show that data-driven organizations outperform their peers. According to Harvard Business Review and Google research, companies that inject data and analytics into their operations are more productive and profitable on average—data-driven organizations enjoy 3-5% higher enterprise output, as cited in Accenture’s research.
I recently worked with a mid-sized manufacturer who had invested in six different analytics tools over three years—yet executives still couldn’t answer basic questions about business performance. After developing a proper BI strategy, they consolidated to two platforms, defined clear metrics ownership, and established regular data review sessions. Within six months, they were using data to drive actual decisions, not just create pretty reports.
Building your BI strategy blueprint:
- Start with a quick assessment—rate your current analytics maturity on a scale of 1-5
- Identify your top three business challenges that better data could help solve
- Prioritize the trends from this article that directly address those challenges
- Create a phased 12-month roadmap with clear goals for each quarter
- Define how you’ll measure success beyond just technology implementation
Turning Analytics Trends Into Your Competitive Advantage
The gap between data haves and have-nots is closing fast. In 2025, mid-sized businesses have an unprecedented opportunity to leverage these business intelligence trends without enterprise-level resources or budgets.
The real question isn’t whether you’ll adopt these technologies—it’s how strategically you’ll implement them to solve your specific business challenges.
- Start with strategy, not technology. Identify your most pressing business problems first, then select the BI approaches that solve them.
- Focus on people and process, not just tools. The most sophisticated dashboard is worthless if teams don’t know how to use it or don’t trust the data.
- Build your foundation first. Governance and data quality aren’t flashy, but they’re essential prerequisites for everything else.
- Consider BI services to accelerate implementation where in-house expertise is limited.
The companies that thrive in 2025 won’t necessarily be the ones with the biggest data teams or the most expensive tools. They’ll be the ones that connect their business intelligence investments directly to measurable outcomes—increased revenue, reduced costs, improved customer satisfaction.
Organizations with cohesive data strategies are significantly more likely to report data-driven decision making as a competitive strength. The year 2025 will be remembered as a tipping point where AI and BI became inseparable and data truly became democratized. Make sure your business is on the right side of that transformation.
Your mid-sized business can absolutely compete in the data-driven economy. Start with one or two trends from this list, implement them properly, and build from there. By this time next year, you could be making decisions with the same data-driven confidence as your largest competitors.
What’s your first step? I’d recommend a quick assessment of your current BI capabilities against these trends. Where are your biggest gaps? Which trend would deliver the most immediate value? Start there, and the path forward will become clear.


