TL;DR
- 71% of CPG leaders adopted AI by the end of 2024, yet only 4% generated enterprise-wide value. This article closes that gap with a ranked list of use cases and a prioritization matrix.
- McKinsey identifies consumer insights and customer or channel management as the two highest-value pools in consumer packaged goods analytics. Start there, then expand.
- Trade promotion optimization and demand forecasting are the fastest paths to proven ROI, typically within 60 to 90 days, when baseline data already exists.
QUICK ANSWER
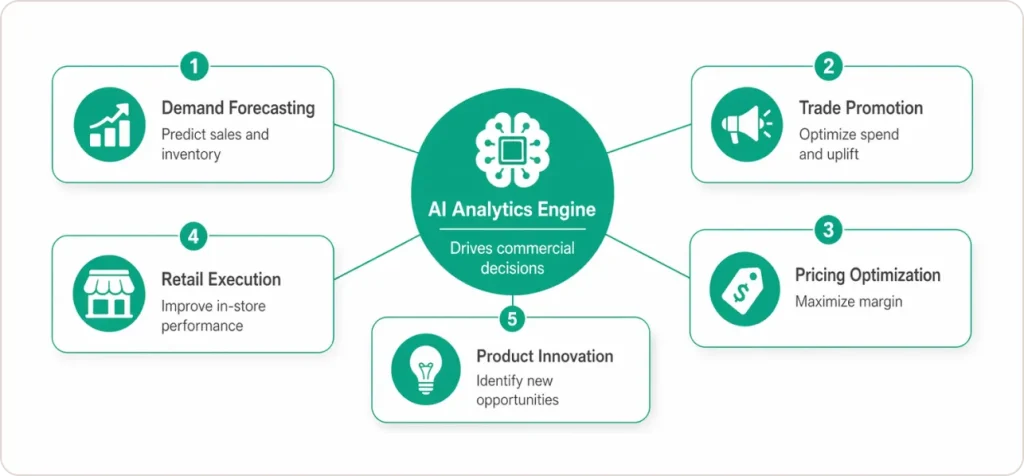
CPG analytics use cases are the specific commercial decisions, including demand forecasting, trade promotion, pricing, retail execution, and product innovation, where AI models generate measurable ROI for consumer packaged goods manufacturers. According to McKinsey, consumer insights and customer channel management deliver the highest value for most CPG sub-sectors.
Most CPG brands have invested in analytics. Most have run pilots. Very few have connected those pilots to a real number on the P&L. The pattern is consistent: strong technology, no use-case prioritization, and no bridge between what the model recommends and what the commercial team actually does next.
This article is a structured breakdown of CPG analytics use cases that are generating real business value in 2026. For each one, I will tell you what data it needs, who owns it, how long it takes to prove ROI, and, critically, which one you should start with. The prioritization choice matters more than the platform you pick.
What Is CPG Data Analytics, and How Does It Differ from Retail Analytics?
CPG data analytics is the discipline of using structured and unstructured data, from point-of-sale transactions and panel studies to shelf images and social sentiment, to make better commercial decisions across pricing, promotion, assortment, supply, and innovation. The AI layer adds predictive and prescriptive modeling, allowing those decisions to happen faster and at a scale no analyst team can match manually.
The distinction from retail analytics matters. CPG analytics is built around the manufacturer’s perspective: trade investment efficiency, portfolio performance, consumer demand signals, and category contribution. Retail analytics is built around the retailer’s perspective: basket economics, loyalty behavior, and store-level operations. The two increasingly intersect in joint business planning and category management, but the underlying decision logic is different.
Private label pressure, post-inflation volume recovery, and retailer data demands have made consumer packaged goods analytics a commercial priority rather than a back-office function. Brands that spent 2022 to 2024 building this capability are measurably better positioned in retailer negotiations and in speed of response to demand shifts.
What Are the 8 CPG Analytics Use Cases That Actually Deliver Business Value?
1. Why Is Consumer Insights Analytics the Highest-Value CPG Use Case?
Consumer insights analytics is the highest-value use case in CPG because it directly shapes where commercial investment goes. AI models applied to panel data, social listening, retailer loyalty data, and media signals detect demand shifts weeks before they appear in syndicated point-of-sale data, giving brand teams the lead time to move media weight, adjust distribution priorities, and respond to consumer segment changes before the window closes.
Unilever’s weather‑integrated demand‑sensing implementation is one of the most cited examples: by connecting weather forecasts to an ice cream‑focused AI agent, the company reported a 30% sales increase in key markets where the model was deployed. The technology itself was not the differentiator; the use case was the right external signal (weather) connected to a specific commercial decision (inventory positioning, production scheduling, and waste reduction).
2. How Does Predictive Analytics in CPG Improve Demand Forecasting?
Predictive analytics in CPG demand forecasting replaces historical shipment extrapolation with models that incorporate POS data, retailer portal signals, media spend, and macroeconomic inputs, reducing structural blind spots around emerging demand shifts, competitive activity, and promotional cannibalization. The practical output is fewer stockouts, less excess inventory, and better working capital.
McKinsey documented a personal‑care CPG company that achieved a 13% improvement in forecast accuracy, a 40% reduction in supply shortages, and a 35% reduction in inventory after deploying an AI‑driven forecasting model.
3. What Does Trade Promotion Optimization Actually Look Like in Practice?
Trade promotion optimization uses elasticity models, historical lift curves, and cannibalization analysis to identify which promotional mechanics, price points, and retailer accounts are generating genuine incremental volume versus subsidizing volume that would have happened anyway. Trade spend runs 15% to 20% of net sales on most CPG P&Ls. Even a modest improvement in promotional ROI moves the margin line meaningfully.
Sigmoid documents a CPG client that achieved 14% year‑on‑year sales growth from assortment and store‑mix recommendations after connecting an AI‑driven analytics platform to retailer data, along with significantly faster promotional reporting through unified POS and bottler reporting. Separately, independent research on explainable and AI‑driven machine‑learning models applied to trade promotion has shown approximately 17–20% improvement in promotional ROI.
4. How Is Pricing Analytics Used in Consumer Packaged Goods?
Pricing analytics in CPG uses price elasticity models to determine optimal price points at the SKU, retailer, and geography level simultaneously, then layers in competitive price gap analysis to inform pack architecture decisions. The advance over traditional pricing research is speed and granularity: models can be rerun as competitive conditions change rather than once per planning cycle.
The Clorox case with Kroger’s 84.51° data platform illustrates this clearly. By modeling price gaps and volume inflection points at the retailer level, Clorox moved to a dual‑pricing strategy with documented confidence that the recommendation was optimized for that specific retail environment. A category manager described the output as giving the team greater certainty that they were recommending the optimal pricing structure.
5. How Does Digital Shelf Analytics Reduce On-Shelf Availability Failures?
Retail execution and digital shelf analytics use computer vision applied to in-store shelf images to detect out-of-stocks, planogram compliance failures, and share-of-shelf deviation at scale, then trigger field actions faster than manual audit cycles allow. On-shelf availability failures cost the CPG industry an estimated 4% of annual sales. Computer vision changes the detection timeline from weekly reporting to near-daily alerts.
For brands selling through major digital channels, the same problem exists online. Brands that rely on quarterly syndicated data to detect digital shelf problems find out too late to recover lost rankings or fix content errors.
6. How Does AI Improve Assortment and Category Management Decisions?
AI-powered assortment analytics replaces volume-trend-driven category management with models that incorporate consumer purchase sequences, shopper panel data, and category-level demand signals, allowing category managers to recommend assortments based on incremental category value rather than brand volume share. That framing shift matters for retailer sell-in because retailers want assortment recommendations that grow the category, not just the brand.
A Gartner analysis of advanced category management and AI‑assisted assortment modeling indicates that CPG manufacturers applying AI‑driven approaches tend to see higher category approval rates with major retail partners compared with peers using traditional planogram tools alone. The underlying reason is that AI‑generated recommendations are based on the same types of purchase‑behavior data retailers see internally, which reduces the adversarial nature of the conversation.
7. Is Product Innovation a Viable CPG Analytics Use Case Right Now?
Product innovation is a viable CPG analytics use case right now. Infosys’s 2025 CPG AI radar ranked product development as the most viable functional category for AI application, meaning the area where technology readiness and business value align most clearly. AI models applied to trend signals, ingredient databases, consumer flavor preference data, and competitive product launches are compressing R&D timelines in ways that traditional research methods cannot match.
Mondelez reduced recipe development cycles by a factor of five using AI-assisted ideation. Nestle deployed internal AI tools to accelerate concept workflows across category teams. Most CPG analytics roadmaps still treat innovation analytics as a future-state investment, which is why Infosys’s finding deserves more weight than it typically gets in commercial planning conversations.
8. How Is Big Data Used in the CPG Industry for Supply Chain Resilience?
Big Data in the CPG industry enables supply chain resilience by combining supplier performance data, weather and geopolitical signals, logistics cost data, and demand forecasts into disruption prediction models that surface risk early enough to take action. Supply disruption forecasting, supplier risk scoring, and transportation route optimization are now operational analytics use cases, not pilot programs.
Unilever’s demand sensing system from Terra Technology reduced safety stock by up to 15% while maintaining service levels, reflecting the impact of integrated supply and demand analytics. The working capital release from a 15% safety stock reduction across a global portfolio equates to roughly $300 million annually in savings.
Which CPG Analytics Use Case Should You Start With?
The hardest question is never “what can AI do in CPG?” It is “where do we start, and what data do we need to have before we begin?” The table below scores each use case across five dimensions. Use it as a starting filter.
How to read the Impact scores: Very High = 10%+ improvement in the target metric within one planning cycle. High = 5-10%. Medium-High = 3-5%. These are ranges from documented CPG deployments, not guarantees.
| Use Case | Business Impact | Minimum Data Required | Time to ROI | Complexity | Start Here? |
|---|---|---|---|---|---|
| Trade Promotion Optimization | Very High (10-17% ROI lift) | 2+ yrs POS, promo history, shipments | 60-90 days | Medium | Yes |
| Demand Forecasting | Very High (13%+ accuracy gain) | POS, retailer portals, panel data | 60-120 days | Medium | Yes |
| Retail Execution / Shelf Analytics | Medium-High (4% sales recovery) | Shelf images or field audit data | 45-90 days | Low-Medium | Yes |
| Consumer Insights / Segmentation | High (media efficiency gains) | Panel, loyalty, social, media spend | 90-120 days | Medium-High | Depends |
| Pricing and Pack Architecture | High (margin protection) | POS, competitive price feeds | 90-150 days | High | Depends |
| Assortment / Category Mgmt | Medium-High (8-12% approval lift) | POS, panel, shopper data | 90-180 days | High | Not first |
| Product Innovation | High (cycle time reduction) | Trend feeds, ingredient DB, reviews | 6-12 months | High | Not first |
| Supply Chain Risk | Medium-High (safety stock reduction) | ERP, supplier data, logistics feeds | 90-180 days | High | Not first |
Impact ranges are derived from documented CPG deployments cited in this article. Results will vary based on data quality, team readiness, and commercial decision process maturity.
For most mid-market CPG brands, trade promotion optimization or demand forecasting is the right first use case. The data usually exists internally, the commercial decision is recurring, and ROI can be measured within a single planning cycle.
PepsiCo focuses its analytics investment on four or five high-conviction use cases at any given time, rather than spreading capability so thin that no single use case generates demonstrable ROI. You can read more about how leading brands approach this in our CPG analytics case studies.
What Data Foundation Do You Need Before CPG Analytics Can Scale?
Most analytics initiatives in CPG fail not because of the model but because of the data. This is the point vendors rush past. It deserves direct treatment.
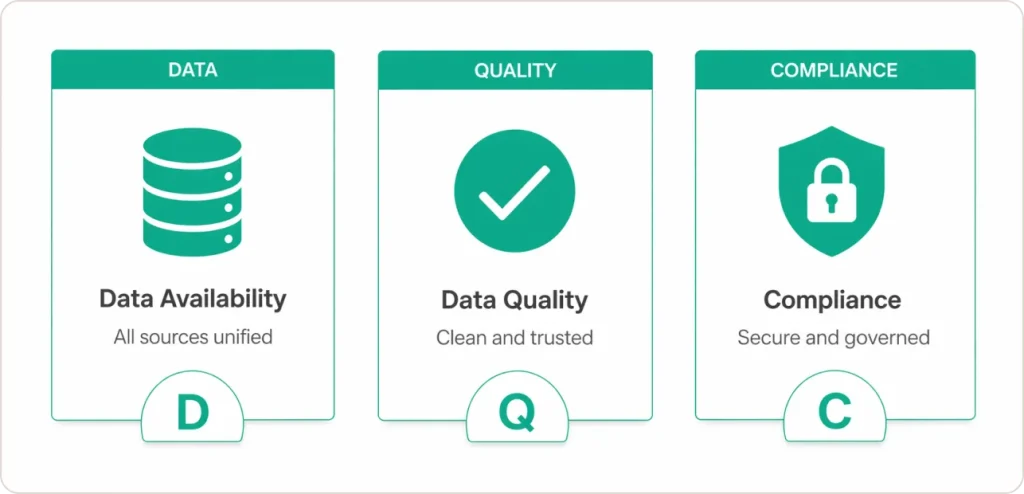
Data availability. The use cases above require some combination of point-of-sale data from Walmart, Target, and Kroger; syndicated panel data from NIQ or Circana; retailer portal data; media investment and performance data; shelf image data for retail execution use cases; and ERP or supply data for forecasting. Most brands have some of this. Very few have it harmonized and accessible in one place.
Data governance and quality. A model trained on promotional history containing duplicate transactions, misaligned time periods, or incorrectly attributed SKUs will produce inaccurate lift estimates that the commercial team will not trust. A 2024 Forrester‑sponsored analysis of enterprise AI adoption found that poor data quality is cited as the primary barrier to AI scaling in a majority of large enterprises, consistent with what practitioners report in the CPG sector specifically.
Privacy and regulatory compliance. In the U.S., CCPA compliance affects how consumer-level data from loyalty programs and DTC channels can be used in segmentation models. FSMA 204 traceability requirements establish specific supply chain data standards through KDEs and CTEs. These must be integrated into data architecture design upfront, rather than retrofitted once models are operational.
“The most important thing is picking the use case where you have the data and the team can act on the output. Solve the boring problems first.”
How Do You Implement CPG Analytics in the Next 90 Days?
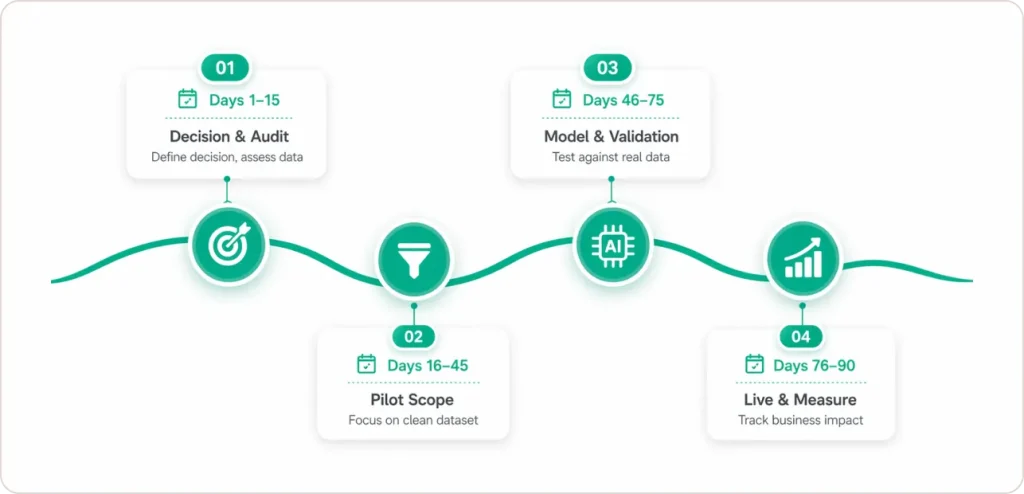
A 90-day implementation frame is realistic for a focused first use case when the data foundation is reasonably solid. Here is how to structure it.
Days 1-15: Decision and data audit. Map the specific commercial decision you want to improve. Identify what data exists, where it lives, and what quality issues need resolution. The central question at this stage: “What decision will be different because of this model?” Analytics programs that cannot answer that in one sentence tend to produce reports, not decisions.
Days 16-45: Pilot scoping and data preparation. Narrow the pilot to a specific category, retailer, or geography where data is cleanest and the commercial team is engaged. Build the data pipeline for that scope only. Identify the commercial team member who will own the output. Unowned analytics outputs are unused analytics outputs.
Days 46-75: Model development and validation. Build and validate against a holdout period. For trade promotion optimization, compare model lift estimates against actual results from a prior promotional event the model was not trained on. If validation is solid, move to deployment. If it is not, fix the data before scaling.
Days 76-90: First live cycle and measurement. Run the first real commercial decision using model output. Measure the result against a pre-agreed business baseline. Document what the model got right, what it missed, and why. That post-cycle learning is more valuable than the model performance itself.
According to Google’s internal research on enterprise AI deployment patterns, organizations that define a specific measurable business outcome before building a model are 2.4 times more likely to move from pilot to production than those that start with a technology capability and search for use cases afterward. For a detailed breakdown of how to structure this readiness assessment, our CPG analytics implementation service covers the methodology in detail.
What Should a CPG Leader Take Away from This?
The analytics capability gap in CPG is real and it is widening. The brands scaling AI-powered analytics, Unilever, PepsiCo, Clorox, and Mondelez, are not doing it because they had larger technology budgets. They are doing it because they chose a specific commercial decision to improve, built the data foundation to support that decision, and ran a disciplined pilot cycle that produced a number they could take to the CFO.
All eight use cases in this article are generating measurable business value somewhere in the industry right now. The question is not whether the use case works. It is whether your data, your team, and your commercial decision process are ready to make the output actionable. That readiness assessment is where most CPG analytics programs should actually begin, before the platform selection, before the vendor conversations, and before the pilot design.