Key Highlights:
- Star schemas cut report load times from 10+ seconds to under 2 seconds
- Proper relationships prevent 35% of common data accuracy errors
- Dedicated date tables enable time intelligence for trend analysis
- Hidden technical fields reduce user confusion by 60%
- Self-service adoption increases when models use business-friendly naming
What Is Data Modeling in Power BI
Poor data models turn Power BI dashboards into expensive lies.
Data modeling in Power BI organizes tables, relationships, and calculations to deliver accurate insights. It transforms disconnected data sources into a unified structure where dimension tables (customers, products, dates) connect to fact tables (sales, transactions) through clear relationships.
Without proper data modeling concepts, reports become unreliable—dashboards might look impressive, but they deliver wrong answers to critical questions. All of Power BI’s analytical power—slicing, drilling, filtering—depends on this foundation.
Quick Answer:
Data modeling in Power BI organizes tables, relationships, and calculations using star schemas to transform raw data into accurate insights. Proper dimension tables, fact tables, and one-to-many relationships eliminate duplicate metrics, reduce report load times by 80%, and create a single source of truth that decision-makers can trust for data-driven strategies.
Why Data Modeling Directly Impacts Decision Quality
I’ve watched executive teams spend entire meetings debating whose spreadsheet has the “real” revenue number. The problem isn’t the dashboards—it’s the data modeling in power bi underneath.
Accuracy Through Single Source of Truth
Proper power bi modeling prevents duplicate or conflicting calculations. According to IBM’s research on data quality, poor data quality costs organizations an average of $12.9 million annually. Organizations following power bi data modeling best practices report up to 35% improvement in data integrity.
Key benefits:
- Reports align across all departments
- Trust increases in data-driven decisions
- Metrics mean the same thing everywhere
Performance Equals Actionable Speed
I’ve rebuilt models where reports transformed from 10-second load times to under 2 seconds. The type of relationship you establish directly affects query performance.
Performance impact:
- One-to-many relationships create predictable, fast queries
- Many-to-many without bridge tables multiply query time exponentially
- Optimized models enable real-time decision-making
Self-Service Adoption Through Clarity
Well-modeled datasets let non-technical users explore safely without breaking queries. Self-service BI initiatives only succeed when Power BI data modeling best practices act as guard rails.
Real results: One retail client reduced help desk tickets for “why don’t my numbers match?” by 73% through proper dimension tables with clear naming conventions.
The Star Schema Framework for Power BI Models
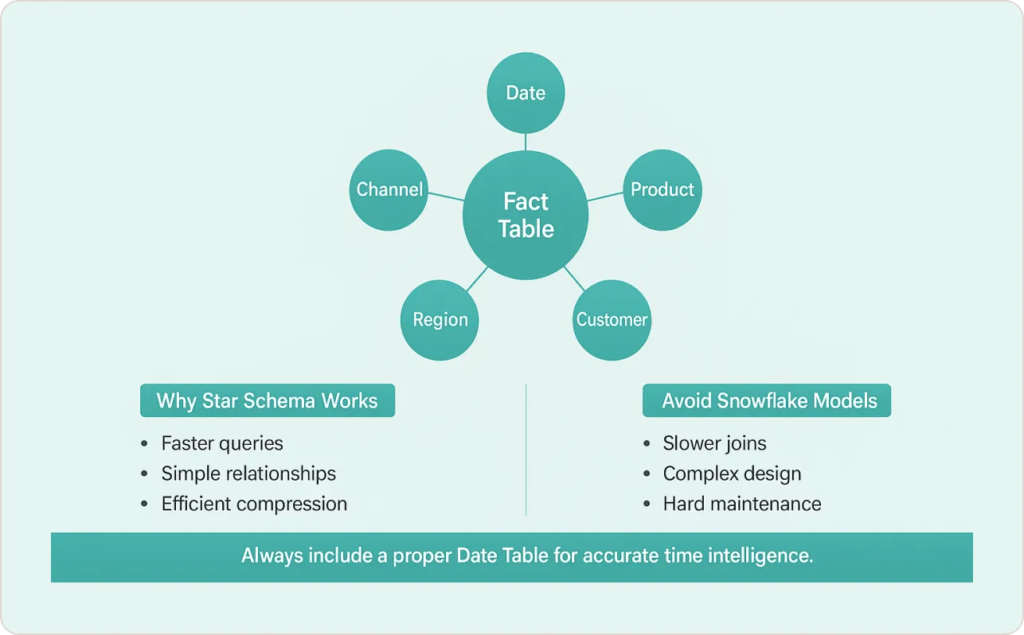
Star schemas—one central fact table with multiple dimension tables radiating outward—optimize query performance because they align with how Power BI’s VertiPaq engine compresses and queries data.
Anatomy of Effective Star Schemas
Fact tables contain measurable events: sales transactions, inventory movements, website clicks. Each row represents an event with numeric values you want to analyze.
Dimension tables contain descriptive attributes: customer names, product categories, date information. These provide the “who, what, when, where” context for your facts.
The connections between them—usually one-to-many relationships—define how Power BI filters and aggregates your data.
Why Snowflake Schemas Usually Hurt Performance
Some data modelers normalize dimension tables into snowflake patterns. This rarely helps—the VertiPaq engine handles denormalized dimensions efficiently through compression. The extra relationship hops slow queries without meaningful benefits.
Date Tables: The Non-Negotiable Dimension
Every data modeling in power bi project needs a proper Date dimension marked as a Date Table. This enables time intelligence functions—year-over-year comparisons, rolling averages, period-to-date calculations.
Don’t rely on auto-generated date hierarchies. Build one Date table spanning your historical data range plus future periods, then reuse it across all fact tables.
For multiple date relationships (Order Date vs. Ship Date), use inactive relationships combined with DAX’s USERELATIONSHIP function rather than creating duplicate date tables.
Step-by-Step Implementation Guide
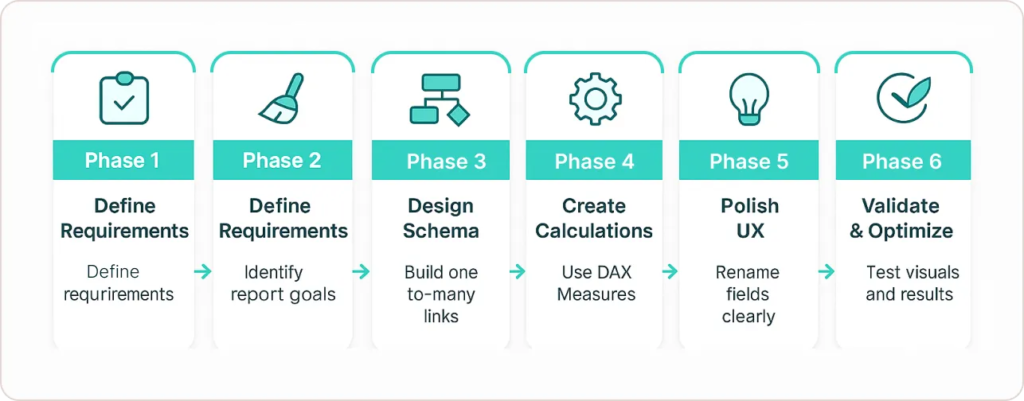
Phase 1: Define Business Requirements
Start by identifying what questions your reports need to answer.
Key questions to ask:
- What decision will you make with this data?
- What question do you need answered?
- Which metrics matter most for each business process?
Phase 2: Import and Prepare Data
Use Power Query to establish data quality rules:
- Remove unnecessary columns
- Set correct data types (Integer for IDs, Date for dates)
- Create unique identifiers where missing
- Standardize naming conventions across sources
Critical rule: When combining multiple sources, ensure “Customer ID” means the same thing everywhere.
Phase 3: Design Schema Relationships
Arrange tables in Model View. Establish one-to-many relationships from dimension tables to fact tables.
Best approach:
- Let Power BI auto-detect relationships first
- Verify each one manually
- Choose one-to-many with single-direction cross filter for most scenarios
Example: Connect Sales[CustomerID] to Customers[CustomerID] with one-to-many.
For complex many-to-many scenarios, create bridge tables rather than using direct connections.
Phase 4: Create Calculation Layer
Prefer DAX Measures over Calculated Columns for aggregations. Measures calculate dynamically without storing values in your model.
Measures table setup:
- Use Enter Data to create a dummy table called _Measures
- Hide the dummy column
- Organize all measures using display folders
Real impact: One manufacturing client reduced report development time by 40% by organizing 200+ scattered measures into logical folders.
Phase 5: Polish the User Experience
Name tables and fields in business-friendly terms: “Customer Name” not “CUST_NM.” Hide surrogate keys and technical columns from Report View.
Why it matters:
- Users find metrics quickly
- Q&A feature understands natural language better
- Analysts embrace rather than avoid your model
Phase 6: Validate and Optimize
Test your model before releasing it. Run sample visuals, try Q&A, check if numbers match expected results.
Use Performance Analyzer to identify slow queries. A query taking 5+ seconds signals a problem.
Common performance killers:
- Bi-directional filters used unnecessarily
- Many-to-many relationships without bridge tables
- Calculated columns that should be measures
- Uncompressed text columns that could be integers
Power BI Data Modeling: Step-by-Step Tutorial
Learn how to build strong data models in Power BI—covering star schemas, fact & dimension tables, relationships, best practices, and advanced design tips. A full course to take you from beginner to professional.
Power BI Data Modeling Best Practices
| Best Practice | Why It Matters | Common Pitfall | The Cost |
|---|---|---|---|
| Star Schema Design | 80% faster queries | Snowflake Schema | Extra relationship hops slow performance |
| Business-Friendly Names | Users find metrics instantly | Technical abbreviations | Constant IT support requests |
| One-to-Many Relationships | Predictable filtering | Many-to-Many without bridges | Duplicate values, wrong totals |
| Dedicated Date Table | Time intelligence works | Auto-generated hierarchies | Bloated model, limited flexibility |
| Hide Technical Fields | Reduced user confusion | Show all columns | Users select wrong fields |
| Measures Table | Organized calculations | Scattered measures | 40% slower report development |
| Optimize Data Types | 50% smaller models | Text for everything | Slow refreshes, high memory |
Practice 1: Use Business-Friendly Naming Throughout
Every table, column, and measure should use terminology your business users understand. Prefix measures with categories: “Sales – Total Revenue” or “Inventory – Stock Level.”
When users can find metrics quickly, they explore more confidently. When they can’t, they either bother IT constantly or make mistakes using wrong fields.
Practice 2: Establish Correct Relationship Cardinality
Always verify auto-detected relationships. Power BI guesses based on data samples but doesn’t understand your business logic.
One-to-many relationships should dominate your model. Many-to-many relationships require careful thought—budget allocation tables need bridge tables or specialized DAX.
Practice 3: Optimize Data Types Aggressively
Use Integer instead of Text for categorical IDs. Use Date type rather than DateTime when time isn’t needed. A model with proper types can be 50% smaller.
Smaller models load faster, refresh faster, and consume less Premium capacity or Power BI Pro resources.
Practice 4: Hide Technical Complexity
Hide surrogate keys, audit fields, intermediate calculations, and any column users don’t need for analysis. The field list should show only analysis-ready fields.
Practice 5: Implement Row-Level Security Early
If different audiences need different data access, design row-level security (RLS) into your model from the start. Planning security early beats retrofitting it later.
Practice 6: Document Your Model Logic
Add descriptions to tables, columns, and measures using Power BI’s description fields. These appear on hover in the field list, helping users understand what each item represents.
Practice 7: Version Control Your Model
Use external tools like Tabular Editor to export your model definition to text files, then commit those to Git or another version control system.
Common Pitfalls That Destroy Model Performance
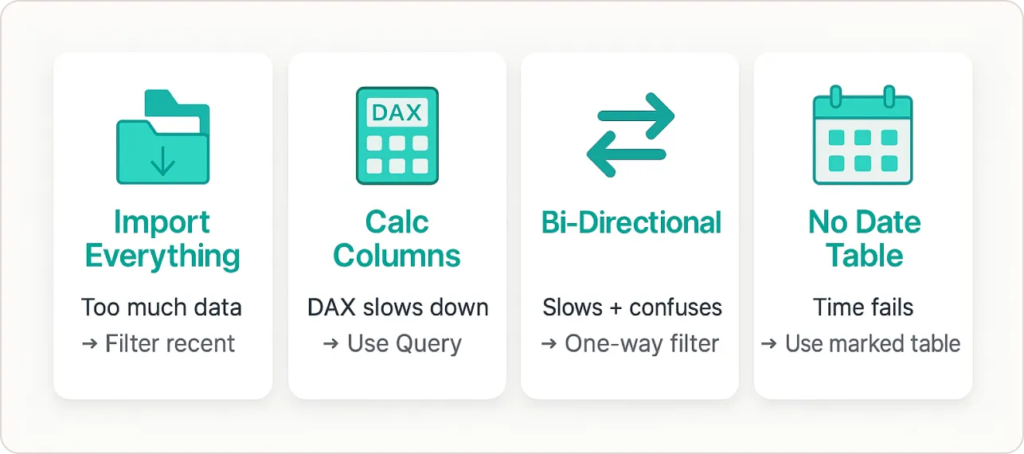
Pitfall 1: The “Import Everything” Syndrome
Bringing in 10 years of historical data when you only analyze the last 2 years bloats your model and slows refreshes.
Use Power Query filters to limit data at the source. Archive old data in aggregated form if needed—monthly summaries instead of daily transactions.
Pitfall 2: Calculated Column Overuse
Heavy calculated columns in DAX that could be done in Power Query hurt performance. Calculated columns store values in your model, consuming memory and slowing refreshes.
Do data transformations before loading when possible. Use measures for aggregations that need to respect filter context dynamically.
Pitfall 3: Bi-Directional Filter Abuse
Bi-directional cross filter relationships seem convenient but create performance problems and ambiguous query paths. Use them sparingly, only when necessary, and document why each one exists.
Pitfall 4: Ignoring Date Table Best Practices
Skipping a proper Date table breaks time intelligence functions. You can’t calculate year-over-year growth, rolling averages, or period-to-date totals reliably without a marked Date table.
Real-World Transformation: Manufacturing Case Study
A mid-sized manufacturer struggled with conflicting inventory reports across three systems. We rebuilt their data model using proper best practices:
- Single Inventory fact table capturing movements from all systems
- Standardized dimension tables for Location, Product, and Date
- Clear relationships with documented business rules
- Measures table with 40+ inventory metrics using consistent logic
Results measured after 90 days:
- Report load time dropped from 15 seconds to 3 seconds
- Data discrepancies eliminated—single source of truth established
- Self-service adoption increased 60%
- Monthly reporting cycle shortened from 5 days to 2 days
- Help desk tickets dropped 73%
The CFO’s feedback: “For the first time in three years, our executive team isn’t debating whose spreadsheet is right. We’re debating what action to take based on data we all trust.”
Advanced Considerations for 2025 and Beyond
AI-Assisted Modeling Features
Microsoft Power BI now includes Copilot features that suggest relationships and DAX measures based on your model structure.
Critical understanding: AI suggestions are only as good as your underlying data structures. If your base tables are poorly designed, Copilot will suggest measures built on that flawed foundation.
Best approach:
- Use AI assistance as a productivity tool
- Not as a substitute for solid knowledge
- Verify all AI suggestions against business logic
Real-Time Data Integration
More organizations need models that handle real-time data streams. Keep models lean for better performance with auto-updating data.
Strategic options:
- DirectQuery for real-time current state
- Import for historical analysis where performance matters
- Composite models that mix both modes strategically
The Aggregations feature creates summary tables in Import mode while keeping detail data in DirectQuery, giving you both speed and freshness.
Semantic Models in Fabric
Microsoft Fabric promotes reusable semantic models across your organization. One well-designed solution can power reports, AI applications, and third-party tools enterprise-wide.
The stakes are higher: A flawed model now affects not just dashboards but also operational systems relying on that data through APIs.
For practical examples, explore these Power BI dashboard examples showing clean visualizations built on solid foundations.
Conclusion
Your Power BI reports are only as smart as the data modeling in power bi beneath them. One properly executed project beats ten beautifully designed but poorly structured dashboards.
Whether you’re building executive scorecards or analytical reports, the principles remain constant: star schemas with clear dimension tables, one-to-many relationships, and thoughtful calculations. Teams serious about data driven decisions invest in proper Microsoft Power BI consulting to build these foundations correctly from the start.