")
Small business owners today face an unprecedented challenge: they’re generating more business data than ever before, but most of it remains locked away in systems they can barely navigate. Every transaction, customer interaction, and operational metric creates valuable information that could transform decision-making—if only it were accessible.
The shocking reality is that businesses sitting on goldmines of data are making critical decisions based on incomplete information, costing them thousands in missed opportunities every month.
Here’s a mind-blowing stat: by 2025, global data creation will hit 181 zettabytes annually¹, and with 33.2 million small businesses in the U.S. alone, even the smallest companies are generating massive amounts of valuable data every single day.
But here’s what really gets my attention: Gartner predicts that data storytelling will dominate business intelligence by 2025, with 75% of data stories automatically generated through AI. The businesses that figure out data visualization for small business now will have a massive competitive edge over those still stuck in spreadsheet hell.
In this guide, I’ll show you exactly how to determine if investing in data visualization for small business makes sense for your budget, what kind of ROI you can expect, and which tools actually deliver results without breaking the bank.
Why Every Small Business Needs to Think About Data Visualization Right Now
Let me be completely honest with you: the data revolution isn’t coming—it’s already here. And if you’re not visualizing your business data, you’re probably making decisions with one hand tied behind your back.
The Human Brain Loves Visual Information (And Your Business Should Too)
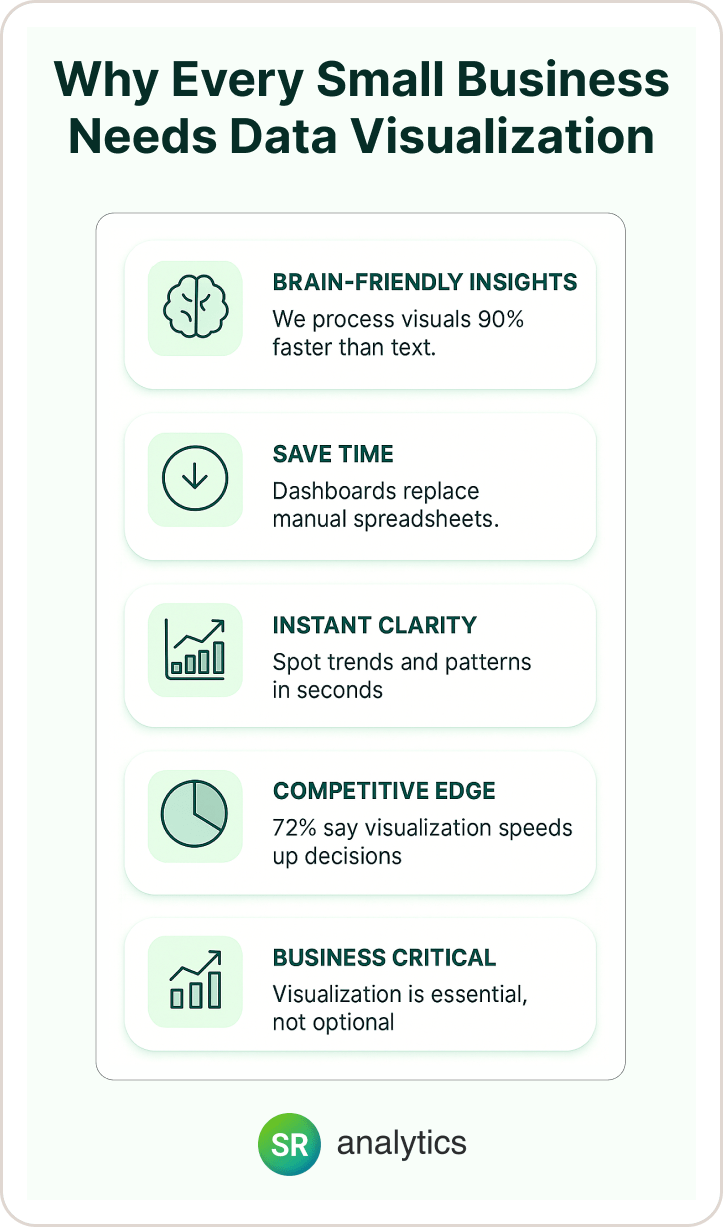
Here’s something fascinating: our brains process visual information 90% faster than text. We retain 65% of visual information three days later, compared to just 10% of what we hear. This isn’t just cool neuroscience—it’s a massive business advantage waiting to be unlocked.
I worked with a local restaurant chain that was spending hours every week manually reviewing sales reports from their POS system. The owner would literally print out pages of numbers and try to spot trends with a highlighter. Once we set up simple dashboards showing their data visualization for small business metrics, they could identify their busiest hours, best-selling items, and seasonal patterns in seconds instead of hours.
Your Competitors Are Already Moving
Here’s what I see happening in the market: while some businesses hesitate because they think data analytics tools for small business are “too advanced” or expensive, their competitors are making faster, smarter decisions with the same information.
Red flag alert: If you’re still making strategic decisions based on gut feeling while your competitors are using data-driven insights, you’re already falling behind.
The numbers back this up. According to recent research, 72% of companies believe that visualization helps them make faster decisions. In today’s fast-moving business environment, decision speed often determines who wins and who gets left behind.
Pro tip: Any business collecting customer data, sales information, or operational metrics should be visualizing it. The benefits of data visualization for SMEs aren’t just nice-to-have anymore—they’re table stakes for staying competitive.
The Real Benefits of Data Visualization for Small Business (With Actual Numbers)
When I first got into this field, I thought data visualization for small business was mainly about making prettier charts. Boy, was I wrong. The real benefits of data visualization for SMEs go way deeper and directly impact your bottom line.
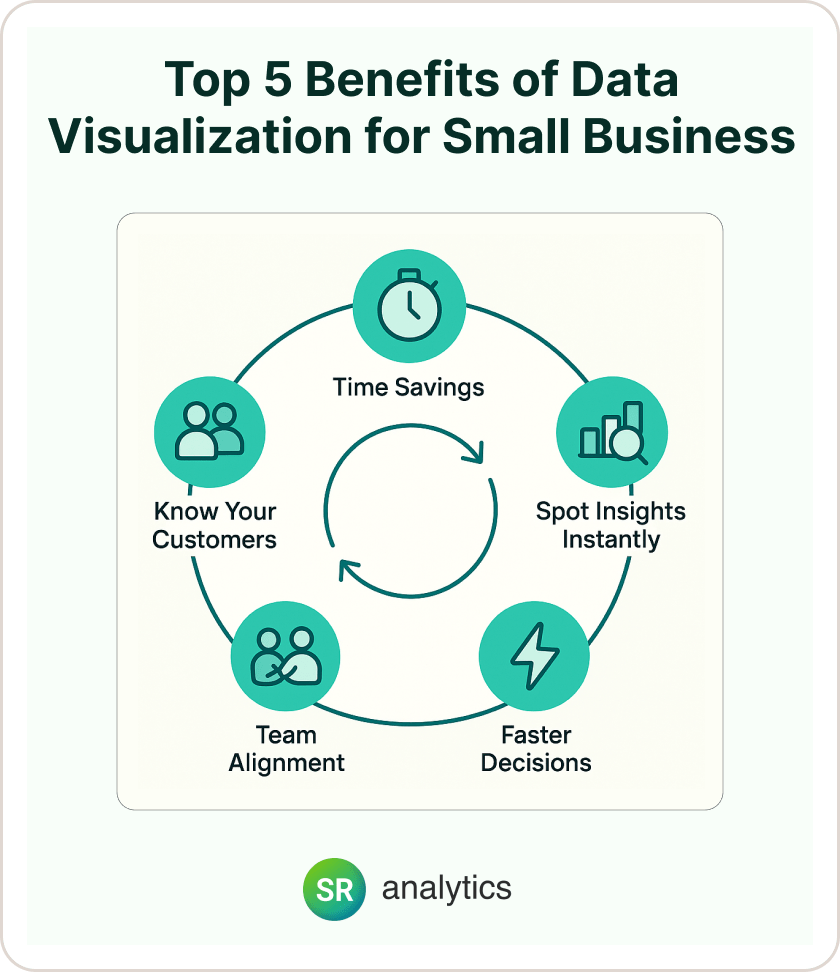
1. Massive Time Savings (That Add Up Fast)
Here’s what I always ask clients: How many hours does your team spend each week creating reports, updating spreadsheets, and trying to make sense of your business data?
Most business owners are shocked when they actually calculate it. The typical small business spends 10-15 hours per week on manual data tasks that could be automated with the right data analytics tools for small business.
Real example: A construction company I worked with had their project manager spending two full days every month creating progress reports for clients. After implementing Power BI dashboards, this became a 30-minute task. That’s 15.5 hours per month freed up for actual project management—time that directly generates revenue.
2. Spot Problems and Opportunities Instantly
Let me ask you this: could you identify a 15% drop in customer satisfaction from looking at a spreadsheet, or would you see it immediately in a trend chart? The answer’s obvious, right?
Case Study: E-commerce Customer Retention One of my e-commerce clients was seeing declining repeat purchases but couldn’t figure out why. Their spreadsheets showed the numbers, but data visualization for small business revealed the story: customers who received follow-up emails within 24 hours of purchase had 3x higher repeat purchase rates. This single insight led to an automated email sequence that boosted repeat sales by 40%.
The benefits of data visualization for SMEs become crystal clear when you can spot patterns that would take hours or days to find in raw data.
3. Make Decisions 10x Faster
Here’s the thing: in small businesses, decision speed often matters more than perfect information. With real-time dashboards, you can answer critical business questions in seconds instead of waiting for someone to “pull the numbers.”
I remember working with a retail client during their busy holiday season. Instead of waiting until the end of each week to see how promotions were performing, they could check their dashboard every morning and adjust pricing or inventory levels immediately. This flexibility alone increased their holiday revenue by 25% compared to the previous year.
4. Get Your Whole Team on the Same Page
Non-negotiable: Your dashboards should eliminate arguments about what the data actually says.
I’ve sat through too many management meetings where half the time was spent arguing about whether sales were up or down because everyone was looking at different reports. When your marketing team, sales team, and operations team are all looking at the same visual metrics, alignment happens naturally.
Research from The Wharton School shows that data visualization for small business can cut meeting time by up to 24%. That’s nearly 10 hours per month saved in a business that has 4 hours of meetings per week.
5. Understand Your Customers Like Never Before
This is where data visualization for small business really pays off. By visualizing customer behavior patterns, purchase histories, and engagement metrics, you can identify your most profitable segments and the marketing channels that actually work.
Client success story: A local SaaS startup discovered through customer journey visualizations that users who completed their onboarding tutorial within the first week had 5x higher lifetime value. This insight completely changed their onboarding strategy and increased average customer value by 60%.
ROI Reality Check: What Data Visualization Actually Costs (And Returns)
Okay, let’s talk about money. The biggest pushback I get about data visualization for small business investments is cost concerns. But when you run the actual numbers, the ROI story is pretty compelling.
The Real Cost Breakdown
Budget-friendly options:
- Google Data Studio: Free
- Power BI Desktop: Free
- Zoho Analytics: Free tier, then $24/user/month
- Tableau Public: Free (with public sharing)
Professional options:
- Power BI Pro: $10/user/month
- Tableau Cloud: $15/user/month
- Sisense: $2,000/month for small teams
Here’s my honest assessment: Most small businesses can get started with professional-grade data analytics tools for small business for under $100/month total.
ROI Calculation Framework
Time savings value: Hours saved per week × hourly wage rates × 52 weeks
Decision speed improvement: Revenue impact of 20% faster decision-making
Error reduction: Cost of poor decisions prevented Efficiency gains: 12-15% operational improvements (industry average)
Real Client ROI Examples
Case Study: Regional Marketing Agency
- Initial investment: $18,000 (Power BI + setup + training)
- Results after 6 months:
- 50% reduction in client reporting time
- 30% faster campaign optimization
- 25% increase in client retention (clients loved the transparency)
- Total ROI: 280% in year one
Case Study: Medical Practice
- Investment: $8,000 (Tableau + dashboard development)
- Results:
- 25% reduction in patient wait times
- 18% increase in daily patient capacity
- $180,000 additional annual revenue from efficiency
- Payback period: 2.5 months
The reality: These aren’t cherry-picked success stories. When implemented correctly, the benefits of data visualization for SMEs typically deliver measurable ROI within 3-6 months.
Best Data Analytics Tools for Small Business (2025 Edition)
| Tool | Best For | Key Features |
|---|---|---|
| Power BI | Businesses using Microsoft products | Excel integration, Gartner leader, free desktop tool |
| Tableau | Growing teams needing advanced analytics | Top-tier visuals, strong user community |
| Zoho Analytics | SMBs needing enterprise-grade features | AI assistant, integrates with 50+ tools (e.g. QuickBooks, Mailchimp) |
| Google Data Studio | Marketing teams using Google Workspace | Real-time reports, strong for web + ad analytics |
| Datawrapper | Beautiful charts for presentations | Simple, fast, exportable charts and maps |
After implementing dozens of solutions, here’s my honest breakdown of the data analytics tools for small business that actually deliver value:
Enterprise-Grade Options That Won’t Break the Bank
Microsoft Power BI
- Cost: Free desktop version; $10/user/month for Pro
- Best for: Businesses using Microsoft products (Excel, Office 365)
- Why it works: Microsoft has been a Gartner Magic Quadrant leader for 17 consecutive years¹¹
- Real talk: If you’re already paying for Microsoft 365, this is usually your best bet
Tableau
- Cost: $15/user/month for cloud version
- Best for: Growing businesses needing advanced analytics
- Strengths: Most powerful visualization capabilities, huge user community
- Downside: Steeper learning curve, but designed for business users, not just data scientists
SMB-Focused Solutions
Zoho Analytics
Cost: Free for basic use; $24/user/month for full features
- Best for: Small businesses wanting enterprise features at SMB prices
- Integration win: Connects to QuickBooks, Mailchimp, and 50+ other tools
- Cool feature: Built-in AI assistant for analysis
Google Data Studio
- Cost: Completely free
- Best for: Marketing-focused teams already using Google Workspace
- Perfect if: You’re tracking website performance, ad campaigns, social media
- Limitation: Requires some technical knowledge for complex dashboards
Specialized Options
Datawrapper
- Cost: Free basic version; $19/month for business features
- Best for: Creating charts for presentations and marketing materials
- Sweet spot: Simple, beautiful visualizations without the complexity
My selection process: Start with what you already use. Microsoft ecosystem? Go with Power BI. Google-heavy business? Data Studio makes sense. Need something in between? Zoho Analytics offers the best feature-to-price ratio.
Best Practices in Data Visualization (That Actually Work)
After helping hundreds of businesses implement data visualization for small business solutions, here are the best practices in data visualization that consistently deliver results:
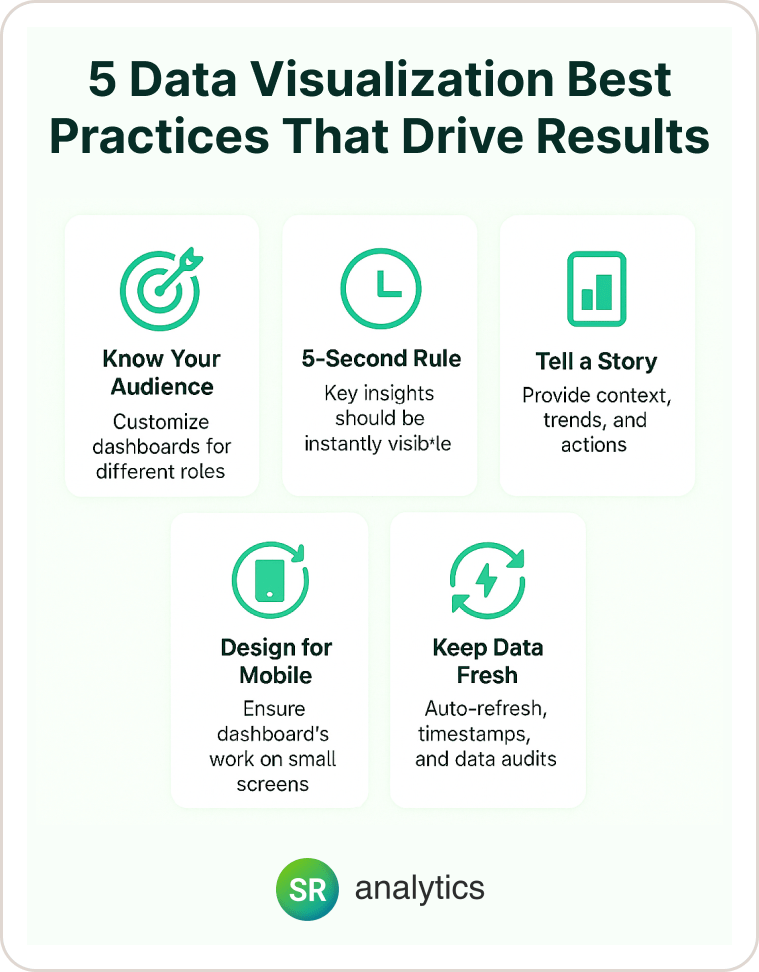
1. Know Your Audience (This Changes Everything)
Executives want: High-level KPIs they can understand in 10 seconds Operations teams need: Detailed, actionable metrics they can act on immediately
Sales teams prefer: Real-time pipeline data and performance comparisons
Here’s what I always ask: “What specific decisions will this dashboard help you make?” That question drives everything from chart selection to layout design.
2. Follow the 5-Second Rule
Golden rule: Any critical insight should be obvious within 5 seconds of looking at your dashboard.
Best practices in data visualization include:
- Most important metric goes top-left (that’s where eyes go first)
- Use color strategically (red for problems, green for good performance)
- Limit each dashboard to 5-7 key visualizations max
- Make trends obvious with clear directional indicators
3. Tell a Story, Don’t Just Show Data
Here’s where most data visualization for small business projects go wrong: they show data without context. Every good dashboard tells a story that flows logically:
- “Here’s where we are now” (current KPIs)
- “Here’s how we’re trending” (time series charts)
- “Here’s what’s driving the trends” (breakdown analysis)
- “Here’s what we should do about it” (insights and recommendations)
4. Design for Mobile (Seriously)
Non-negotiable: Your dashboards must work on smartphones. Mobile data analytics tools for small business usage is growing 40% annually¹², and many business decisions happen outside the office.
My mobile test: If you can’t get the key insight from your dashboard on a 6-inch screen, it needs redesigning.
5. Keep Data Fresh and Accurate
Trust destroyer: Nothing kills dashboard adoption faster than outdated or wrong information.
Best practices in data visualization for data freshness:
- Set up automatic refresh schedules
- Include “last updated” timestamps
- Build data quality checks into your process
- Do monthly audits to ensure connections are working
When Data Visualization Makes Sense for Your Business
Here are the clear signals that your business is ready for data visualization for small business investment:
Green lights:
- You create reports manually more than once a week
- Team discussions often get stuck on “what do the numbers actually say?”
- You have multiple data sources (CRM, accounting, website analytics, social media)
- People regularly ask “what happened last month/quarter?”
- You’re considering hiring someone just to manage reports
Yellow lights (maybe wait):
- You have less than 6 months of consistent business data
- Core business processes aren’t documented yet
- You’re changing major systems frequently
- Your team struggles with your current basic tools
The sweet spot: Most businesses see clear benefits of data visualization for SMEs when they hit $500K+ annual revenue or 10+ employees. At this scale, time savings and decision improvements typically justify investment quickly.
The Future of Small Business Data (Spoiler: It’s Visual)
The landscape is changing fast. At the 2025 Gartner Data & Analytics Summit, experts made it clear: real-time intelligence isn’t optional anymore, even for small businesses.
What’s coming:
- AI-powered insights: 75% of data stories will be automatically generated by 2025
- Natural language queries: Just ask your dashboard questions in plain English
- Embedded analytics: Data Visualization Tools for SMEs built directly into the tools you already use
- Real-time collaboration: Teams analyzing data together, wherever they are
My prediction: Within 3 years, basic data visualization for small business will be as essential as having a website or accounting software.
Ready to Get Started?
Here’s the bottom line: data visualization for small business isn’t a luxury anymore—it’s a competitive necessity. With data creation exploding and decision speed becoming crucial, businesses that can quickly turn information into insights will dominate their markets.
The numbers don’t lie:
- Global data visualization market growing from $7.6B to $10.2B by 2025
- 72% of companies seeing faster decisions with visualization
- 12-15% operational efficiency gains being reported across industries
Your action plan:
- This week: Calculate time currently spent on manual reporting
- Next week: Try a free tool with your cleanest data source
- Within 30 days: Have your first dashboard answering critical business questions
- Within 90 days: Measure ROI and plan expansion
The cost of getting started is minimal, but the cost of falling behind competitors who make faster, data-driven decisions grows every day you wait.
Need expert help implementing the right solution? Our data analytics consulting services specialize in helping small and medium businesses unlock the benefits of data visualization for SMEs through strategic implementation. We’ve guided over 50 companies through successful Power BI implementations and comprehensive business intelligence transformations.
Don’t let your competitors gain the advantage while you’re still wrestling with spreadsheets. The data visualization for small business revolution is happening now—be part of it.


