If you’ve ever felt torn between choosing Power BI and Tableau for your small business, you’re not alone.
When I first started helping small companies implement business intelligence solutions, I often saw them overwhelmed by Tableau’s steep costs and complexity. From my experience, small teams need something powerful yet approachable – not a tool that requires a data science degree to use effectively.
Here’s the thing: Power BI’s adoption has skyrocketed – 90% of Fortune 500 companies use Power BI today, and thousands of small businesses are following suit. Meanwhile, the global BI market is projected to reach $43B by 2028, meaning more businesses are investing in analytics than ever.
In 2025, with tighter budgets and an increasing need for data-driven agility, choosing the right BI tool is mission-critical for small businesses. The landscape has shifted: Microsoft’s Power BI is innovating rapidly, while Tableau’s once-dominant lead in visualization is narrowing.
In this guide, I’ll walk you through 5 key reasons why Power BI better than Tableau for small businesses, backed by real-world insights and data. You’ll learn exactly why the benefits of Power BI can save you money, time, and headaches – and how to smoothly make the switch if you decide to.
Key Highlights: What You’ll Learn
- Save 70% on BI costs – Real case studies showing dramatic cost reductions when switching from Tableau to Power BI
- Faster team adoption – Why Power BI’s Excel-familiar interface reduces training time from 40 hours to just 8 hours per user
- Seamless Microsoft integration – How Power BI connects instantly with Office 365, Teams, and SharePoint for effortless collaboration
- AI-powered insights – Access monthly AI updates and natural language features at no extra cost (while Tableau charges premium)
- Migration made simple – Step-by-step strategies to overcome common challenges when moving from Tableau to Power BI
- Community advantage – Leverage 5 million Power BI users vs Tableau’s 0.25 million for faster problem-solving
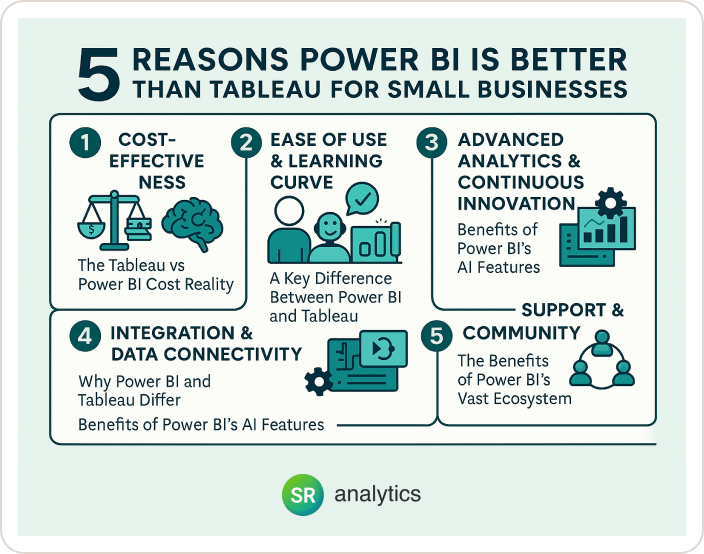
Reason 1: Cost-Effectiveness – The Tableau vs Power BI Cost Reality
When examining the difference between Power BI and Tableau, pricing is the #1 reason small businesses favor Power BI, and for good reason.

Let me be honest with you: if you’re on a tight budget, Tableau can be a non-starter. Red flag alert: Tableau requires a minimum of about $35×5 = $175/month just to get started with a few users, plus potential server costs. In contrast, Power BI’s entry cost is virtually zero – you can start building reports for free.
Breaking Down the Tableau vs Power BI Cost Difference
The numbers speak for themselves when comparing Power BI and Tableau:
- Power BI Pro: ~$10/user/month
- Tableau Creator: $70/user/month
- Power BI Desktop: Free for development
- Tableau: 14-day trial only for private business data
For example, a 10-person company would pay $100/month on Power BI Pro for all users, versus $700/month on Tableau (Creator licenses) – a 7x difference. Over a year, that’s nearly $7,200 saved, which could fund other projects or hires.
The Total Cost of Ownership Advantage
Here’s my rule: always consider the total cost. Power BI includes cloud sharing (Power BI Service) in that $10 fee, whereas with Tableau you might need to invest in Tableau Online or Server for collaboration. Plus, Power BI’s frequent updates come at no extra charge, while Tableau upgrades could mean additional training or upkeep costs.
Case Study Spotlight: One migration study found switching to Power BI led to 70% cost savings on BI expenses. The Netceed company not only saved on licensing but also reduced infrastructure and training costs significantly, completing their migration 2X faster than expected.
This dramatic cost difference is one of the clearest benefits of Power BI over Tableau. But saving money isn’t worthwhile if the tool can’t deliver. Fortunately, Power BI backs up its affordability with ease of use – which brings us to reason #2.
Reason 2: Ease of Use & Learning Curve – A Key Difference Between Power BI and Tableau
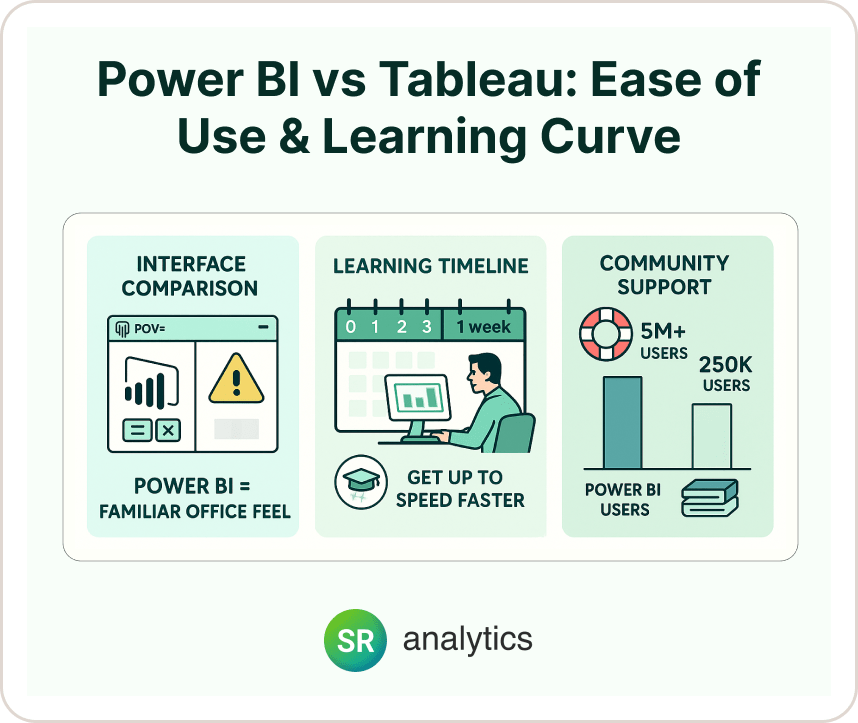
The reality is that a BI tool should empower your team, not intimidate them. When examining Power BI and Tableau side by side, Power BI shines in usability for the average business user, especially if you’re familiar with Microsoft products.
Tableau is powerful, but many find its interface less intuitive. It often requires specialized training to unlock its full potential. By contrast, Power BI feels familiar from day one – its interface resembles Excel and other Office apps, and its formula language DAX is like Excel’s cousin.
From My Experience: Real-World Learning Curves
From my experience helping teams adopt these tools, new Power BI users start creating basic dashboards within a week. Tableau often took longer for folks to get comfortable – I’ve seen small business owners give up when faced with Tableau’s initial complexity.
This difference between Power BI and Tableau becomes especially apparent when training non-technical staff. Non-negotiable: your BI tool must be easy for non-IT staff. Power BI’s drag-and-drop interface and natural language Q&A make it extremely user-friendly.
For example, the Q&A feature lets you type ‘Show sales by product for 2023’ and it generates a chart on the fly. Tableau has a similar ‘Ask Data’ feature, but it’s separate from the main interface, whereas Power BI’s Q&A is built-in and ready to use.
Community Support Advantage
Here’s what I always tell clients: the size of a tool’s community can determine how quickly you solve problems. With Power BI, you have millions of users and a responsive Microsoft community forum at your fingertips. Stuck on a formula? A quick search will likely find an answer.
Let me be honest: Tableau’s community is passionate too, but smaller – Power BI has approximately 5 million users versus Tableau’s 0.25 million, meaning fewer how-to articles and YouTube tutorials geared toward beginners.
So, your team can get up to speed faster with Power BI. But what about actually getting insights from your data? That’s where integration and data handling showcase another key difference between Power BI and Tableau – reason #3.
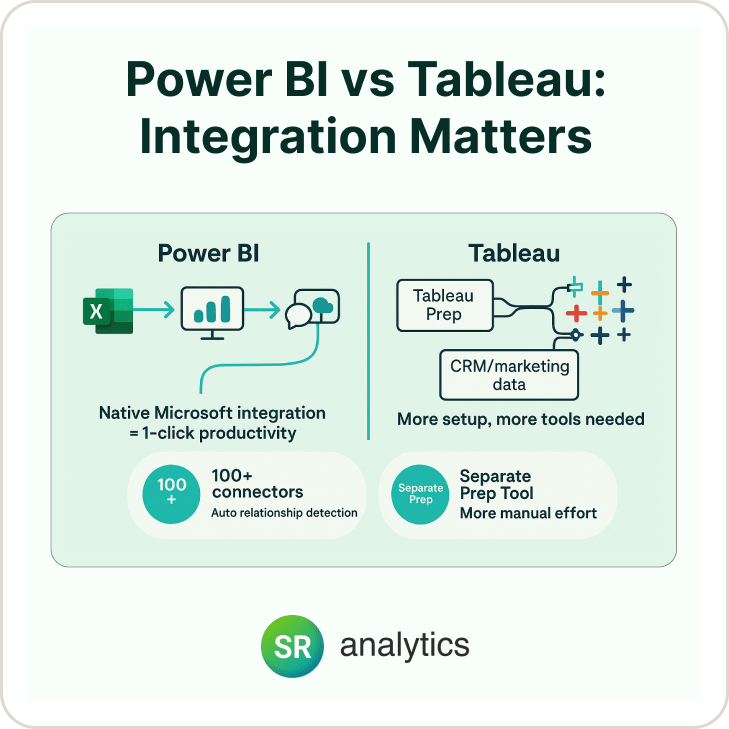
Reason 3: Integration & Data Connectivity – Why Power BI and Tableau Differ
Here’s the thing: small businesses don’t have time to stitch together dozens of tools. Power BI plugs right into your existing workflow if you’re using Microsoft products, which most businesses do.
Microsoft Ecosystem Advantage
Because Power BI is part of the Microsoft Power Platform, it natively integrates with Office 365 (Excel, SharePoint, Teams), Azure databases, and more.
For instance, you can easily export a Power BI visual to Excel for a colleague, or embed live interactive dashboards in a Teams channel for everyone to see. This kind of out-of-the-box integration represents one of the core benefits of Power BI and is a game-changer for productivity.
Power BI has 100+ data connectors (Salesforce, Google Analytics, QuickBooks, etc.) and Microsoft is constantly adding more. Tableau also has many connectors, but here’s the difference: Tableau can connect to many sources too, but often it requires more technical setup and deep data understanding to troubleshoot those connections.
Power BI tends to make the connection process simpler – sometimes even automating relationship detection between datasets.
Small Business Scenario
Imagine you’re pulling sales data from Excel, customer data from a CRM, and marketing stats from Mailchimp. In Power BI, you can connect to all three within minutes. Tableau might handle it, but if you need to do custom data prep, you might have to use Tableau Prep (the separate ETL tool) – adding complexity to your workflow.
Vendor Independence vs. Ecosystem Leverage
Conversely, one might say Tableau is more ‘vendor-independent’ (not tied to Microsoft). But for a small business already using Windows or Office, leveraging that Microsoft ecosystem is an advantage, not a lock-in drawback. It means less configuration and a smoother experience.
Yes, Tableau can tackle bigger data out-of-the-box (it doesn’t have the 1GB dataset limit that Power BI Pro does). But red flag alert for Tableau: if you need that scale, you’re probably not a ‘small’ business or you’d need Tableau’s costly server. Most small businesses find Power BI’s capacity more than sufficient – and it’s expanding with Microsoft’s updates (plus you can use Power BI Premium per user if needed for larger data).
With your data connected and flowing seamlessly, the next step is making sense of it. And that’s where Power BI’s evolving capabilities showcase why Power BI better than Tableau for innovation – our reason #4.
Reason 4: Advanced Analytics & Continuous Innovation – Benefits of Power BI’s AI Features

The reality is that the BI space is evolving fast. Power BI’s pace of innovation has been blistering – which represents one of the major benefits of Power BI for users who automatically get new features each month.
Microsoft rolls out Power BI updates monthly, so you’ll often see new AI visuals or connectors appear overnight. With Tableau, the update cycle is slower and big new features are less frequent.
AI Features That Matter
Power BI has introduced AI-driven insights like the Key Influencers visual, anomaly detection, and even a new Copilot that uses GPT-style natural language to help build reports. Here’s what I look for: tools that make advanced analytics accessible. Power BI lets you do things like ask questions in plain English or get automated insights (‘Explain the increase in sales’) with a click. From my experience, these features can surface trends that a small team might have missed.
Pro tip: take advantage of these Power BI AI features – they’re included at no extra cost. Tableau has some AI capabilities (like Ask Data and Explain Data), but they haven’t been as user-friendly or prominent for non-technical folks. And often, harnessing Tableau’s machine learning potential means integrating with other tools or writing Python/R – which small businesses may not have bandwidth for.
Staying Future-Proof
With Microsoft committing heavily to the Power Platform, you can bet Power BI will keep getting better. This means a small business can adopt it today and still be on a cutting-edge platform 5 years from now – without needing to switch tools again. In tech, that peace of mind is huge.
Microsoft is even unifying analytics through Microsoft Fabric (which Power BI is part of) to integrate data engineering, warehousing, and BI in one ecosystem. Small businesses might not use all that now, but choosing Power BI opens doors to those capabilities as you grow – all under one roof.
It’s no surprise Gartner has kept Microsoft Power BI in the Leaders quadrant for many years, partly due to this continuous innovation and vision.
So far, we’ve covered cost, ease, integration, and innovation – four compelling reasons why Power BI better than Tableau. But what about support and community? As a small business, you need all the help you can get – which leads to our final reason.
Reason 5: Support & Community – The Benefits of Power BI’s Vast Ecosystem
When you’re adopting a BI tool without a dedicated IT department, community and support can’t be overlooked. Power BI’s community is a massive safety net for small businesses.
The Power BI community forum has over 1.4 million posts covering almost every question imaginable (everything from formula help to gateway errors). Microsoft’s support team and MVP experts actively participate, meaning answers come quick.
Tableau vs. Power BI Support Comparison
Tableau’s community, while strong in its own right, is smaller. Tableau offers official support with a year of standard support on license purchase, then paid renewals, which might be overkill or too pricey for a tiny company. In contrast, with Power BI, many answers are one Google search away, and Microsoft’s documentation is thorough and freely available.
As part of the Office 365 family, Power BI is covered by Microsoft’s robust support infrastructure – you might even have access to support through your existing Microsoft 365 admin portal without extra cost.
Ease of Switching (Lower Friction)
Now, what if you’re already on Tableau and worried about the challenges of moving from Tableau to Power BI? Switching friction is surprisingly low if planned right. Power BI’s familiarity and the available migration tools make it easier than you’d expect to transition.
For example, Microsoft and partners offer migration accelerators that can convert Tableau workbooks to Power BI reports. And because of the huge community, you can find playbooks for ‘Tableau to Power BI’ transitions.
Of course, I won’t sugarcoat it: moving from Tableau has its challenges. You may need to rebuild some complex dashboards, and staff will need training on the new tool. Red flag alert: don’t try to do it all at once. Instead, migrate in phases – maybe start with one department or a set of key reports.
The good news is, many small companies find that since Power BI is easier, employees actually adapt quickly, especially with proper change management and maybe a bit of professional guidance.
Here’s my take: leverage the community and available resources when switching. There are free guides and even consultants who have done this before. You don’t have to go it alone.
Overcoming the Challenges of Moving from Tableau to Power BI
By now, the advantages showing why Power BI better than Tableau for small businesses are clear. If you’re convinced but concerned about the migration process, let’s quickly cover how to mitigate the key challenges of moving from Tableau to Power BI.
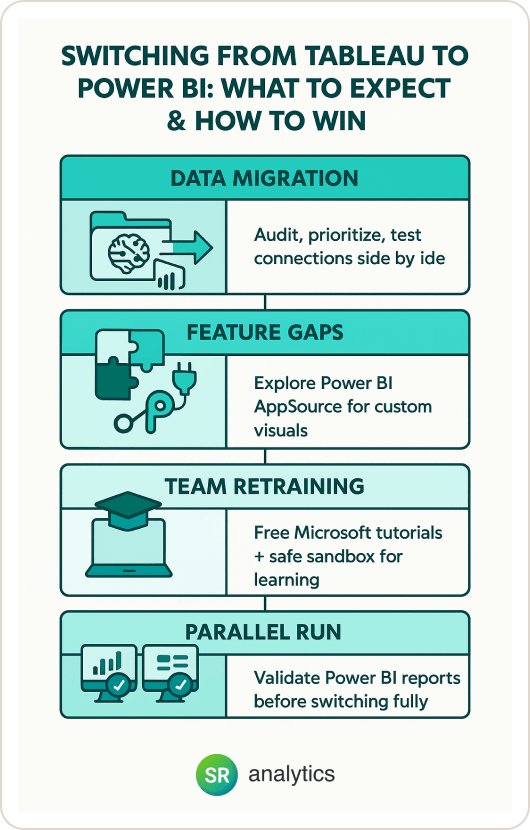
Data Migration & Rebuilding Dashboards
Challenge: Reconnecting data sources and recreating reports represents one of the primary challenges of moving from Tableau to Power BI.
Solution: Audit your Tableau content and prioritize key dashboards first. Use Power BI’s robust data modeling (Power Query) to replicate necessary transformations. Many Tableau data sources (SQL, Excel, etc.) will connect to Power BI easily – test each connection and validate results side by side during transition.
Loss of Niche Features
Challenge: Some Tableau-specific visuals or functions may not exist in Power BI (or work differently).
Solution: Identify critical Tableau features your team uses and research Power BI equivalents or custom visuals. Power BI’s AppSource has a huge gallery of custom visuals – chances are there’s one to fill any gap. Also, Power BI’s functionality is expanding; features like the Decomposition Tree and Smart Narratives were introduced to cover advanced analysis scenarios that might have required workarounds in Tableau.
Team Retraining
Challenge: Getting your team comfortable with a new tool represents another key challenge of moving from Tableau to Power BI.
Solution: Leverage Microsoft’s free learning resources (Microsoft Learn tutorials, YouTube channels) and consider a workshop. The learning curve is shorter, but hands-on practice is key. Encourage a culture of experimentation – Power BI’s undo/redo and sandbox nature lets users play without fear.
Parallel Run to Ensure Continuity
Lastly, it’s wise to run Power BI and Tableau in parallel for a short period. You can gradually roll out Power BI reports and validate them against existing Tableau reports for accuracy. This reduces risk and builds confidence in the new system.
In my experience, after the initial hump, teams rarely look back. Once they see the cost savings and ease of use that demonstrate why Power BI better than Tableau, the old charts start to lose their appeal – especially when every dollar counts.
Real-World Success Stories: Benefits of Power BI in Action
Let me share a few examples that illustrate the concrete benefits of Power BI over Tableau for small businesses:
Manufacturing Company Case Study: A 50-person manufacturing firm was spending $3,500/month on Tableau licenses. After switching to Power BI, they reduced their BI costs to $500/month – a savings of over 85%. The transition took just 6 weeks, and employees found Power BI’s Excel-like interface much more intuitive.
Retail Chain Migration: A regional retail chain with 200 employees cited the difference between Power BI and Tableau in terms of training time. While their Tableau implementation required 40 hours of training per user, Power BI users were productive after just 8 hours of training – primarily because of the familiar Microsoft interface.
💡 Retail businesses see dramatic results with Power BI. Learn how we helped CPG companies optimize operations and drive growth through data analytics.
Consulting Firm Experience: A business consulting firm noted that one of the major benefits of Power BI was the seamless integration with their existing Microsoft tools.
They could now embed live dashboards directly in client presentations through Teams and SharePoint, something that required complex workarounds with Tableau. These real-world examples demonstrate why examining Power BI and Tableau reveals clear advantages for small business environments.
The Technical Difference Between Power BI and Tableau
While we’ve focused on business benefits, it’s worth understanding some technical aspects that contribute to why Power BI better than Tableau for small businesses:
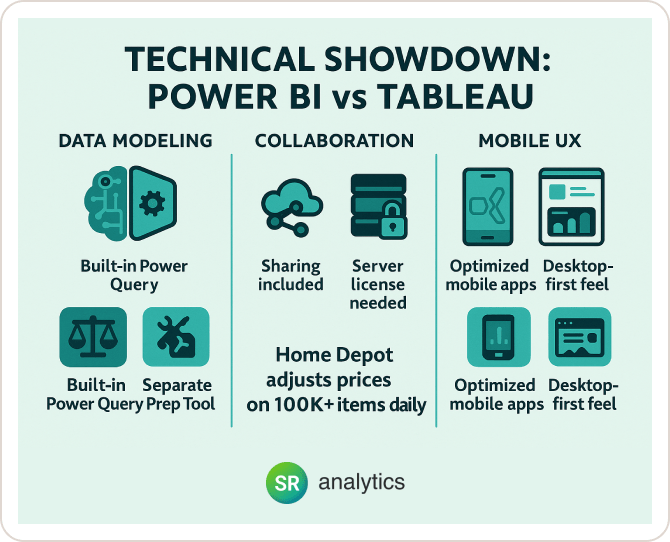
Data Modeling Capabilities
Power BI’s Power Query provides intuitive data transformation capabilities that Excel users find familiar. Tableau requires separate tools like Tableau Prep for complex data preparation, adding complexity and potential additional costs.
Sharing and Collaboration
Power BI includes cloud sharing in its basic Pro license, while Tableau often requires additional server licenses for collaboration. This represents a significant difference between Power BI and Tableau in terms of total cost of ownership.
Mobile Experience
Power BI offers native mobile apps that automatically optimize reports for mobile viewing. While Tableau has mobile capabilities, the experience is often better suited for desktop-designed dashboards.
👉 Choosing Power BI is just the first step. Develop a winning business intelligence strategy that aligns with your business goals.
Making the Switch to Smarter Analytics
To wrap up, let’s quickly recap why Power BI better than Tableau for small businesses. Power BI offers a budget-friendly pricing model, an easier learning curve, tight integration with your favorite tools, continuous innovation, and a supportive community – all tailor-made for the needs of a small business.
Key Takeaways: Benefits of Power BI
- 70% cost savings compared to Tableau’s licensing
- Faster onboarding with Excel-familiar interface
- Seamless Microsoft integration for existing workflows
- Monthly AI updates at no extra cost
- Massive community support with 1.4M+ forum posts
- Lower migration complexity with available tools and resources
The choice is ultimately yours, and Tableau is certainly a capable tool in the right circumstances. But when examining the difference between Power BI and Tableau through the lens of small business needs, Power BI consistently delivers better value.
The tableau vs Power BI cost comparison alone makes a compelling case, but when you add the benefits of Power BI’s ease of use, integration capabilities, and continuous innovation, the decision becomes even clearer.
Why not give Power BI Desktop a try and see the difference for yourself?
Remember, adopting a new BI tool is a journey, not an overnight switch. But with the right approach, you’ll quickly reap the rewards of a more cost-effective, user-friendly, and powerful analytics tool. Here’s to empowering your business with insights – on your terms and budget.