SaaS company selling online courses KPI tracking improved decision making with 6x ROI
Goals
- To help them understand the business and how they can grow using actionable insights from data
Approach
- Audited all current data sources against the business requirements
- Collaborated with the client to understand their KPIs and implement them into Microsoft Power BI
- Provided key recommendations on which metrics are vital
Results
- Increased ROI by 6x
Overview
California based e-learning platform approached SR analytics for building KPI tracking for their whole business. Their main goal was to understand the business and how they can grow using actionable insights. They knew that their current decision-making process was heavily backed by intuition than data.
Challenges
SR analytics’ e-commerce expertise allowed it to understand the business model quickly. SR analytics conducted an audit of their current data sources against the business requirements.
The largest point of friction was to combine all data sources into one single data warehouse.
The data sources contained marketing sources like Google Analytics, FB ads, Google Ads, Bing Ads. Operational sources like CRM data for customer’s product purchases and their interaction with the product and payment processing data.
CRM data was in SQL based databases while other data needed to be pulled from various marketing platforms.
Solution
The tool used: Microsoft Power BI
After collecting the data from various sources into Microsoft’s SQL Server, various relationships were built to connect all data sources in such a way that it reflects the whole customer journey from brand awareness to consuming the product.
SR analytics collaborated with the client to understand their KPIs and implemented them into Microsoft’s Power BI. SR Analytics provided key recommendations on which metrics are important to track and which ones move the needle for the client’s profitability.
Here is a glimpse of some of the important recommendations:
-
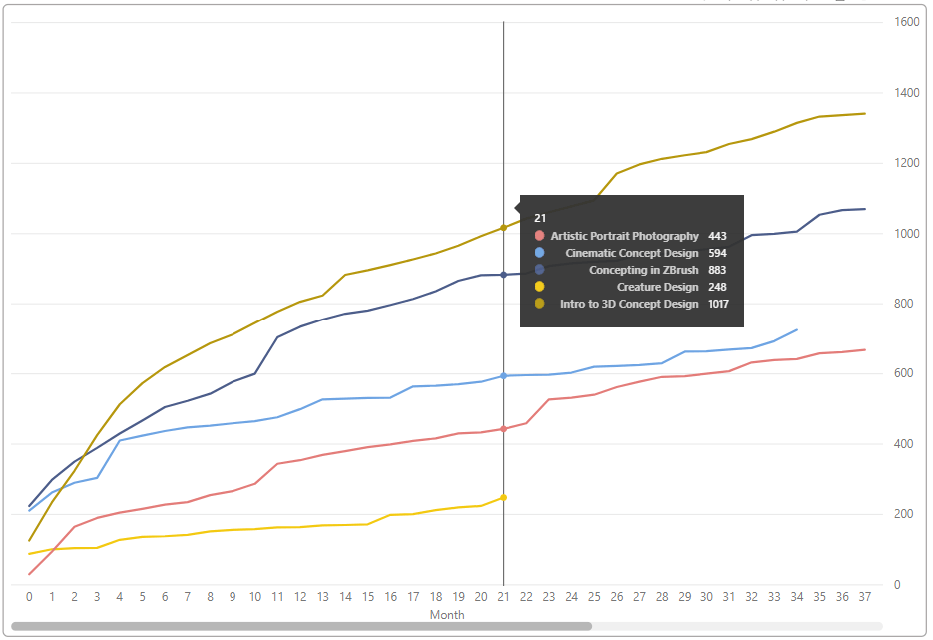
Product Life Cycle Trends: Some of the courses get more traction than others. The chart below showed that some courses have lost their fuel after a few months. Those courses can be chosen to launch discount campaigns so that they can easily scale up.
-
Course Quality Analytics: By visualizing KPIs, the student interaction was very low for some of the courses and students simply did not return after they enroll for those courses. These analytics allowed the client to identify areas of improvement and helped the client to gain insights on which courses to produce.
-
Insights on which products to bundle to generate the highest value: By understanding students’ purchase history, it was evident that students generally purchase multiple courses that were related to one another. These analytics allowed the client to package those courses and sell them as a bundle to effectively deliver the highest value to students.

Results
- Increased ROI by 6x
More great stories
Get ready to level up your business!
Have questions or think you're ready to discuss your business needs? Connect with our consultant.


