TL;DR
- Sigma Analytics is a warehouse-native BI platform that queries live cloud data through a spreadsheet-style interface, with no SQL required.
- A November 2024 Forrester study found a 321% ROI over three years, payback in under six months, and over $2 million in analyst productivity gains.
- The platform never extracts or copies data. Every query runs live against your warehouse, so governance stays at the source.
- It is not right for every team. If your data lives on-premises or you lack a cloud data warehouse, this tool will not solve your problem yet.
Quick Answer
Sigma Analytics, formally known as Sigma Computing, is a cloud-native business intelligence platform that queries data warehouses directly, allowing business users to perform live data analysis through a spreadsheet-style interface without writing SQL.
What Is Sigma Analytics, and What Problem Does It Actually Solve?
Sigma Analytics is a warehouse-native BI platform that connects directly to Snowflake, BigQuery, Databricks, and Redshift, runs every query live, and surfaces results in a spreadsheet-style workbook that requires no SQL knowledge.
The problem it solves is specific. Most legacy BI tools move a copy of your data into their own engine for query speed. That trade-off worked when datasets were millions of rows. It breaks when datasets are tens of billions of rows, when data freshness is non-negotiable, and when governance requires that data never leave the warehouse environment.
The platform discards the extract entirely. Business users get live, accurate data every time they open a report. IT teams inherit role-based access controls directly from the warehouse, with no separate permission layer to configure inside the BI tool. Data engineers do not have to pre-define every question a business user might ask, which is the core bottleneck in Looker-based environments.
Whether that architecture solves your specific problem depends on what your current stack looks like. This review addresses that directly.
How Does a Sigma Dashboard Work, Step by Step?
A sigma dashboard is a live workbook connected directly to your warehouse. Every chart, scorecard, and table runs a fresh query each time a user opens or filters the report. There is no scheduled refresh cycle and no stale extract to debug.
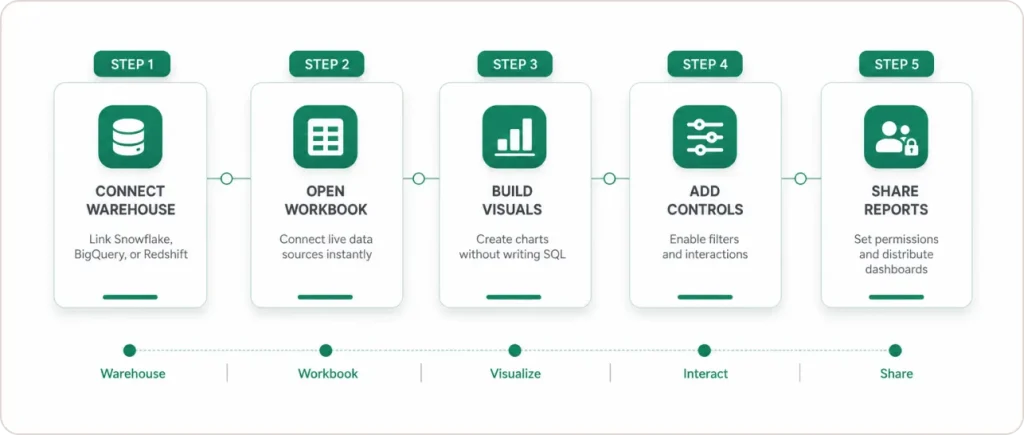
Step 1. Connect your warehouse. The platform integrates natively with Snowflake, BigQuery, Databricks, and Redshift, inheriting your existing role-based access controls automatically on first authentication.
Step 2. Open a workbook and connect a data source. A Sigma workbook functions like a governed spreadsheet. You add tables, apply filters, build calculated columns, pivot sigma data, and create charts within the same canvas.
Step 3. Build your Sigma data visualization. Select the columns you want, choose a chart type, and the visualization updates live as you adjust filters or dimensions. Bar charts, time-series lines, funnel charts, geo maps, and pivot tables are all available without writing a single query. The entire sigma data visualization experience is point-and-click for non-technical users.
Step 4. Add interactive controls. Date pickers, dropdown filters, and cross-filter interactions let business users slice sigma data independently, without any technical involvement from the data team.
Step 5. Set permissions and share. A completed sigma dashboard can be shared as a live link, embedded into an internal portal, or delivered as a scheduled report. Permissions are granular down to row-level conditions inherited from the warehouse.
One honest note: the “quick setup” framing in vendor content assumes your data model is already clean. If your warehouse tables have inconsistent naming conventions or undocumented joins, expect setup to take longer. That is true of any BI implementation.
How Does Sigma Analytics Compare to Tableau, Power BI, and Looker?
The difference between Sigma Analytics and most competing platforms is architectural, not cosmetic.
Tableau and Power BI are extract-based. They pull data from a source, store a copy in their own engine, and query that copy. This makes performance predictable but creates freshness lag, governance complexity, and a ceiling on dataset scale before performance degrades.
Looker is warehouse-native like Sigma Analytics, but requires LookML: a proprietary modeling layer that data engineers must build and maintain before a business user can self-serve on any question. The platform removes that constraint entirely. Any user can explore data on any table they have warehouse access to, without a ticket or a model definition.
| Feature | Sigma Analytics | Tableau | Power BI | Looker |
|---|---|---|---|---|
| Warehouse-native queries | Yes | No, extract-based | No, extract-based | Yes |
| No-code interface for business users | Yes, spreadsheet UI | Partial | Partial | No, LookML required |
| Live data without extracts | Yes | No | No | Yes |
| Writeback to warehouse | Yes | No | No | No |
| AI-assisted analysis | Yes, Ask Sigma | Partial, Tableau Pulse | Yes, Copilot | Limited |
| Row-level security inherited from warehouse | Yes | No, managed separately | No, managed separately | Yes |
| Embedded analytics | Yes | Yes | Yes | Yes |
| Pricing model | Custom quote, three tiers | Published list, approx. $70/creator/mo | From $10/user/mo | Enterprise only, custom quote |
On pricing: the platform does not publish prices at any tier. Three tiers exist: Essential, Business, and Enterprise. Based on Vendr procurement data covering over 100 contracts, the median annual deployment costs approximately $61,000, ranging from $17,500 to over $130,000. Warehouse compute from Snowflake or BigQuery, adds a further 20 to 50 percent to the total cost of ownership, a line item that Tableau and Power BI customers are not typically budgeting for separately.
The writeback capability deserves attention. The platform’s Input Tables let users write data back to the warehouse directly from a Sigma dashboard. A sales team can update a forecast, a finance team can approve a budget line, and a supply chain manager can annotate an anomaly, all within the same interface. Every action creates an auditable warehouse record. No other mainstream BI platform offers this without code.
Where Does Sigma Analytics Fall Short? An Honest Assessment.
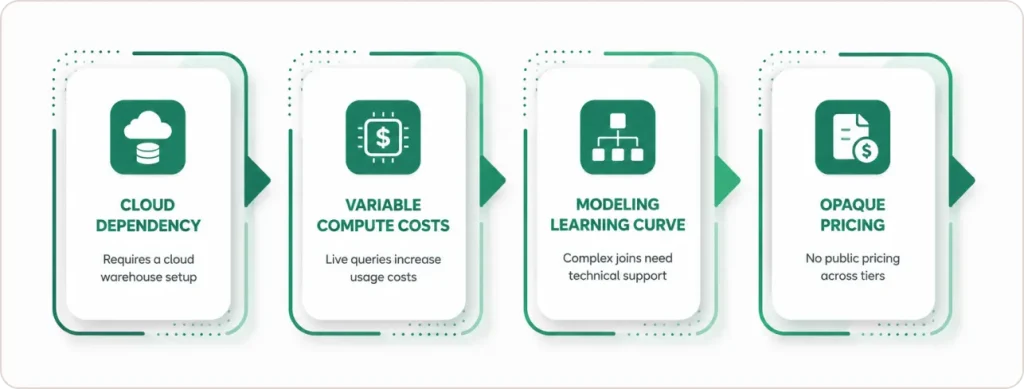
It requires a cloud data warehouse. The platform cannot connect directly to on-premise SQL Server, Oracle, or legacy relational databases. If your data has not yet migrated to a cloud warehouse, this is a second-step purchase, not a first one.
Warehouse compute costs are variable. Because the platform runs live queries rather than extracts, heavy sigma data usage generates meaningful Snowflake or BigQuery compute charges on top of the subscription fee. Teams moving from Tableau or Power BI, where compute is bundled into the platform price, need to budget for this separately.
Complex sigma data analysis across multiple tables has a learning curve. The spreadsheet interface works well for single-table exploration. When a business question requires joining multiple tables or managing relationships across schemas, less technical users typically need a data engineer to set up the underlying model first.
Pricing is opaque at every tier. Unlike Power BI or Tableau, Sigma Analytics provides no public pricing. For procurement teams that need to compare options quickly, this friction adds real evaluation time.
What Do Independent Analysts Say About Sigma Analytics?
According to a November 2024 Forrester Total Economic Impact study commissioned by Sigma, organizations deploying the platform achieved a 321% ROI over three years with payback in under six months. The composite organization in the study was a global B2B company with $2.5 billion in annual revenue. Quantified benefits included over $2 million in data analyst productivity gains and 49,400 hours of end-user time saved in retrieving and analyzing data. The full study is publicly available at Forrester’s TEI site.
According to the 2025 Gartner Magic Quadrant for Analytics and Business Intelligence Platforms, the platform was recognized alongside established vendors in the space. That placement is notable because cloud-native challengers have historically taken longer than legacy incumbents to appear in Gartner quadrants.
As Kieran Kennedy, VP of Data Cloud Product Partners at Snowflake, stated at Snowflake Summit 2025: “Throughout our partnership, Sigma has consistently demonstrated excellence in working with the AI Data Cloud.” (BusinessWire, June 2025)
What those numbers reflect is the elimination of a specific hidden cost: hours spent maintaining extract pipelines, troubleshooting stale data, and answering “why does this number not match the warehouse?” That overhead disappears when the BI tool queries the warehouse directly.
If you are building a business case for the platform and want help framing the ROI argument for your specific environment, the data strategy team can run a cost-benefit assessment before you enter a vendor sales process.
What Does Effective Sigma Data Visualization Actually Look Like?
The platform supports a full range of sigma data visualization types: bar and column charts, time-series lines, scatter plots, funnel charts, filled geo maps, and pivot tables with conditional formatting. Choosing the right format is a communication question, and getting it wrong is one of the most common reasons sigma dashboards fail to drive regular use.
Use scorecards for single KPIs where trend direction matters as much as the absolute number: sessions, revenue, active users, or conversion rate. One number, one period, one decision signal.
Use time-series line charts when your sigma data needs to show change over time. The platform supports dual-axis charts, letting you overlay sessions and conversion rate on the same view.
Use bar charts to compare a metric across categories: revenue by product line, signups by channel, support volume by region. Keep the bar count under ten or the chart becomes decoration.
Use pivot tables when your sigma data analysis involves comparing multiple dimensions simultaneously. Conditional formatting makes this format useful for financial and operational reporting where row-level patterns matter.
The principle that applies across all of these: a sigma dashboard with ten chart types answers no question well. Two or three views built around one specific business question.
How Do You Get Started Without Derailing Your Team?
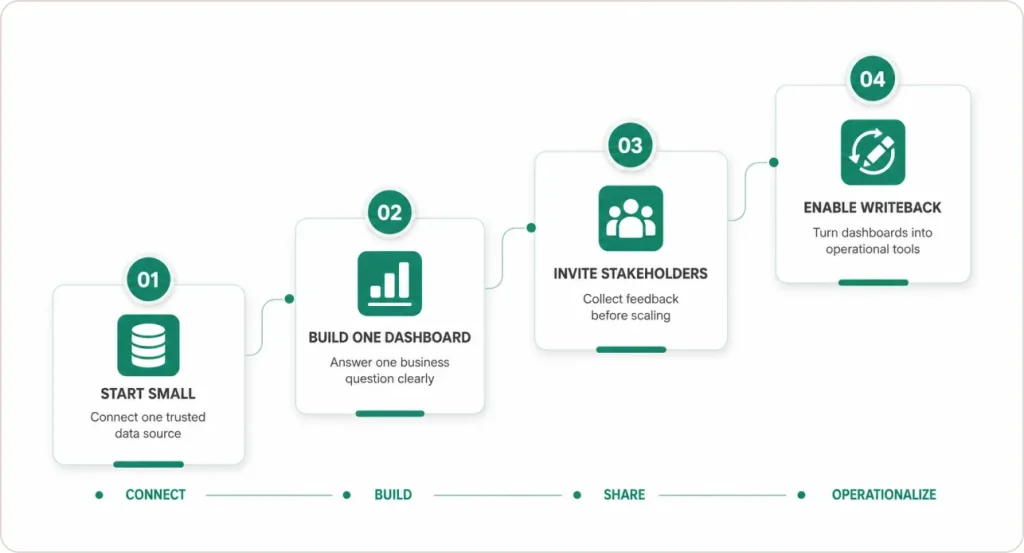
Connect one data source first. Pick the warehouse table your team already understands: a sales transaction table, a marketing events table, or a financial summary model. Scope creep at the connection stage is how implementations stall before producing anything useful.
Build one sigma dashboard that answers one specific question. “What were our top five acquisition channels last month and how did each perform week over week?” produces a useful artifact. “Give us a full business overview” produces a sigma dashboard nobody opens. Specificity drives adoption.
Invite stakeholders before you build more. Share the workbook in view-only mode. The questions your users ask when they first interact with live sigma data will tell you exactly what to build next. Skip this step and you will solve the wrong problems.
Expand to writeback once trust is established. The moment a business user updates a number inside a Sigma dashboard instead of exporting to a spreadsheet, the behavior shift becomes permanent. Version control problems disappear because the warehouse becomes the single record for both analysis and input.on earn regular use.
If your organization needs a structured governance model from day one, working with a certified implementation partner reduces ramp time significantly. The Sigma implementation team at SR Analytics works with companies at this stage, from warehouse readiness through Sigma dashboard architecture and team onboarding.
Conclusion
Sigma Analytics is not a dashboarding tool with extra features. It is a different architectural approach to business intelligence for organizations whose data lives in the cloud.
The case for the platform rests on three points. First, the Forrester TEI study found 321% ROI and 49,400 hours of saved end-user time over three years, driven by eliminating the dependency on data engineers for every custom report. Second, the 2025 Gartner Magic Quadrant placement puts the platform alongside incumbents in a category slow to recognize cloud-native challengers. Third, the writeback capability is genuinely differentiated: no competing platform in the same price range offers no-code warehouse writeback.
The constraints are equally real. The platform requires a cloud data warehouse as a foundation. Compute costs are variable and need their own budget line. Pricing requires a vendor conversation at every tier. And complex sigma data analysis across multiple tables has a learning curve that less technical users will need support to navigate.
The decision is straightforward. If your team runs on Snowflake, BigQuery, or Databricks, loses hours each week waiting for custom reports, and wants business users working directly on live sigma data rather than week-old exports, Sigma Analytics is worth a structured proof of concept. If you do not yet have a cloud warehouse, establish that first.