TL;DR
- Self-service analytics gives business users direct access to data reporting without waiting on IT, reducing report-building time by up to 75% at agencies like NBBC Group.
- The global self-service analytics market is projected to grow from $5.4 billion to $14 billion by 2027, at a 14.6% CAGR, according to industry analysts.
- AI-powered tools, specifically Looker Studio with Gemini, now generate slide decks automatically and answer plain-English data questions in real time.
- The single biggest implementation failure at agencies is granting user access before defining governance rules. Fix the foundation first.
- This post gives you a step-by-step implementation path, a brutally honest tool comparison, and the agency-specific best practices that generic SSA guides leave out.
Quick Answer
Self-service analytics is a business intelligence approach that enables non-technical users to query, visualize, and report on data independently, using governed tools, without requiring SQL skills or IT support.
What Is Self-Service Analytics, and Why Does It Matter Specifically for Agencies?
Self-service analytics (SSA) gives business users, not data engineers, direct control over data exploration and reporting. Users build dashboards, filter by segment, and generate client-ready reports without writing a single line of code or submitting a ticket.
Gartner defines self-service analytics as “a form of business intelligence (BI) in which line-of-business professionals are enabled and encouraged to perform queries and generate reports on their own, with nominal IT support”. This concept centers on democratizing data access so that non-technical users can perform analysis without needing to rely on specialized IT or data science teams.
For a marketing agency running 20 to 50 active client accounts, that impact is severe. Every report cycle involves pulling data from Google Ads, Meta, LinkedIn, GA4, CRM platforms, and sometimes proprietary attribution tools, cleaning it, formatting it, and presenting it in a client-specific template. At most agencies I have seen, that process runs between 40 and 80 hours per month across the reporting team.
NBBC Group, a performance marketing agency, documented exactly this before and after moving to Looker Studio Pro with Funnel.io as their data connector. Their report‑building time dropped by 75%. The same team went from managing a fixed number of client dashboards to handling four times the workload. That result is not magic. It is what happens when the right self‑service data analytics infrastructure eliminates manual assembly at every step of the reporting pipeline — See the full case study
Why Do Marketing Agencies Need Self-Service Data Analytics More Than Other Teams?
Marketing agencies carry a multi-client reporting burden that in-house teams do not face. A single account manager might handle performance data for 15 clients simultaneously, each with different KPIs, data sources, and stakeholder expectations. Traditional BI tools were built for one organization with one data model. Agency reporting is structurally different.
Here is what self-service analytics solves at the agency level specifically.
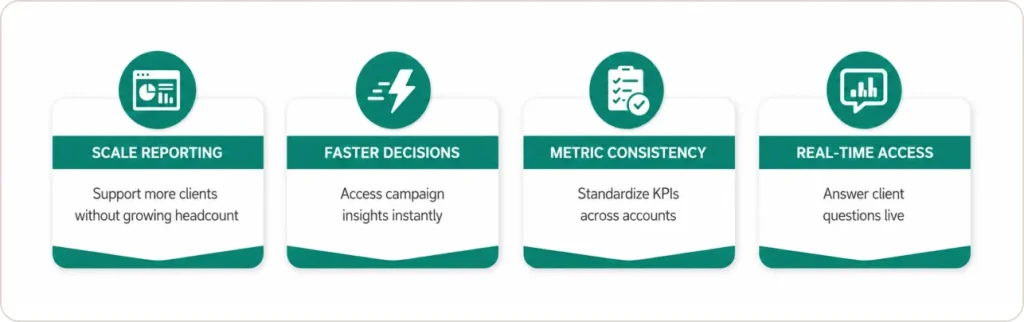
Volume without headcount growth. Agencies generate more reports per team member than almost any other business type. A governed self-service analytics platform lets one analyst support the reporting workload that previously required three, by eliminating the manual steps between raw data and client-ready output.
Speed when it counts. When a campaign underperforms overnight, the account manager needs numbers before the 9 AM client call, not after a data pull request gets resolved on Thursday. Self-serve analytics removes that lag entirely.
Consistency across accounts. Without governed templates, two account managers pulling the same metric from the same platform can produce different numbers because they applied different filters or date ranges. A governed semantic layer ensures that “conversion” means the same thing in every dashboard, for every client, every time.
Real-time independence. Account managers can answer client questions mid-call ight generation in the hands of the people closest to the business problem.” That is exactly what agency account teams do every day. The platforms now exist to match their pace. (Source)by pulling live data themselves, without routing the request to a data analyst. That capability alone changes the perceived value of the agency in the room.
As Exusia puts it, “Self‑service analytics accelerates decision‑making by putting in
How Does a Self-Service Analytics Platform Work? (The Parts That Actually Matter)
Most guides spend three sections explaining the full BI architecture stack. Here is what actually matters for an agency implementation.
The semantic layer translates raw database structures into business language. Instead of a field called tbl_gads_cpc_2024_q3, an account manager sees “Google Ads Cost Per Click, Q3 2024.” More importantly, it locks in metric definitions once, so every user gets the same answer. Before a semantic layer, one account manager’s “47 conversions” is another’s “52 conversions” because they applied different attribution windows. After it is in place, there is one definition applied consistently everywhere.
The governance layer controls data access by role, client, and channel. In a multi-client environment, this is non-negotiable. An account manager for Client A must never accidentally view Client B’s budget data. Row-level security handles this automatically when configured correctly.
The reporting layer is where users interact with data through dashboards, charts, and AI-powered queries. This is where the most significant changes have happened in the past 18 months.
What Are the AI-Powered Features in Looker Studio with Gemini, and Are They Actually Useful?
Looker Studio’s Gemini integration is the most practically useful AI upgrade to hit agency reporting workflows since automated connectors. Here is what each feature does and what it is actually worth.
Conversational analytics lets users type plain-English questions directly into Looker Studio and receive chart-based answers. A user can ask “Which campaigns drove the most conversions last month?” and get a formatted visualization without configuring a single filter. According to Google’s official Looker documentation, Gemini in Looker enables users to interact with data using natural language via Conversational Analytics, significantly reducing the need for technical expertise in query-building and lowering barriers to data discovery.
The Formula Assistant suggests and auto-completes calculated fields. The practical value: instead of an account manager spending 20 minutes trying to write a blended ROAS formula that accounts for platform-specific conversion definitions, Gemini proposes the formula, shows the logic, and lets the user accept or modify it. Before this feature, that task either got delegated to a data analyst or done incorrectly.
Automatic slide deck generation is where the time savings become undeniable. Looker Studio’s Gemini integration connects with Google Slides and generates presentation-ready report slides from live dashboard data on demand. Nicolas Plunkett, founder of NBBC Group, described the impact directly: “The Gemini AI slides feature is a clear time-saver, saving our marketers two to five hours a week each.”
Multiply that across a team of eight account managers, and you recover between 16 and 40 hours every single week from a single feature. That is not a productivity improvement. That is a headcount-equivalent capacity gain, without adding headcount.
How Do the Leading Self-Service Analytics Tools Compare for Agencies?
| Feature | Looker Studio + Gemini | Tableau + Pulse | Power BI + Copilot |
|---|---|---|---|
| Natural language queries | Yes | Limited | Yes |
| Auto-generated slide decks | Yes, via Google Slides | No | No |
| Free reporting tier | Yes | No | No |
| Multi-client access control | Yes, Looker Studio Pro | Yes, enterprise only | Yes |
| Google ecosystem integration | Native | Limited | Limited |
| Microsoft ecosystem integration | Limited | Limited | Native |
| Enterprise governance and compliance | Via full Looker | Strong | Strong |
| Embedded analytics for client portals | Via full Looker, enterprise | Yes | Yes |
| AI formula assistance | Yes | No | Yes |
| Starting price, paid tier | $9/user/month | $75/user/month | $10/user/month |
Where Tableau wins: Enterprise-grade governance and compliance features, particularly for regulated industries. If your agency has clients in financial services or healthcare with strict data handling requirements, Tableau’s governance tooling is more mature than Looker Studio Pro.
Where Power BI wins: Any agency embedded in a Microsoft ecosystem, where clients use Teams, Azure, or SharePoint. Power BI’s native integration with those tools is genuinely superior and the $10 per user entry price is competitive.
Where Looker Studio wins: Any agency already running Google Ads, GA4, and Google Search Console for clients. The native connectors, the free tier for basic dashboards, and the Gemini AI features combine to give the lowest total cost with the highest reporting automation for Google-centric client stacks.
How Do You Implement Self-Service Analytics for Agency Reporting? (Step by Step)
This is the path that gets an agency from manual reporting to a governed, AI-assisted self-service setup. Full implementation takes two to four weeks.
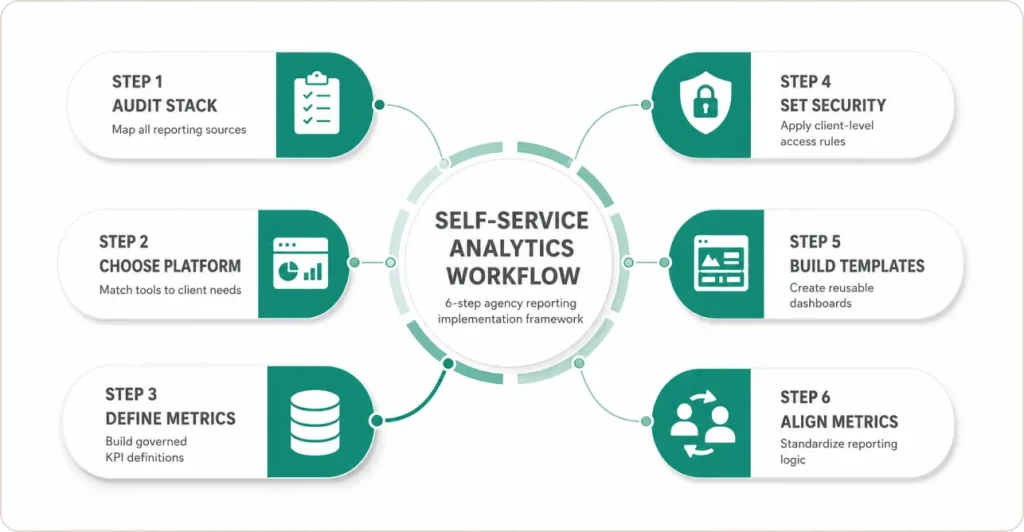
Step 1: Audit your current reporting stack before touching any tool. List every data source you pull from across all clients. Categorize by frequency of use and whether a native connector exists. This takes half a day and prevents weeks of mid-implementation rework.
Step 2: Choose your platform based on your client ecosystem, not tool preference. Google-centric clients: Looker Studio Pro. Microsoft-centric enterprise clients: Power BI. Mixed or regulated industries: Tableau.
Step 3: Build the semantic layer before granting any user access. This is the step most agencies skip and the reason most implementations fail. Before an account manager logs in, every metric must be defined, named, and locked. Set calculated fields for conversion, ROAS, cost per lead, and every KPI your agency reports on. Name them using client language. “Google Ads ROAS (7-day)” is usable. “metric_gads_rev_div_cost_7d” is not.
Step 4: Set row-level security by client at the data source level. Dashboard-level filters can be accidentally removed. Data-level security cannot.
Step 5: Build three to five governed template dashboards. Create templates by client type: ecommerce performance, lead generation, and brand awareness. Gemini-enabled charts should be pre-configured in each. Account managers clone and customize within the governed structure.
Step 6: Run a metric alignment session before going live. This is not a tool training. It is a business logic session. The question you are answering is: “When this dashboard shows 47 conversions, what exactly does that mean?” Agencies that skip this session spend the next six months fielding discrepancy questions from clients.
What Are the Agency-Specific Best Practices That Generic Guides Never Mention?
Every SSA guide tells you to “define governance before opening access” and “train users on the semantic layer.” That advice is correct and also obvious. Here is what those guides leave out.
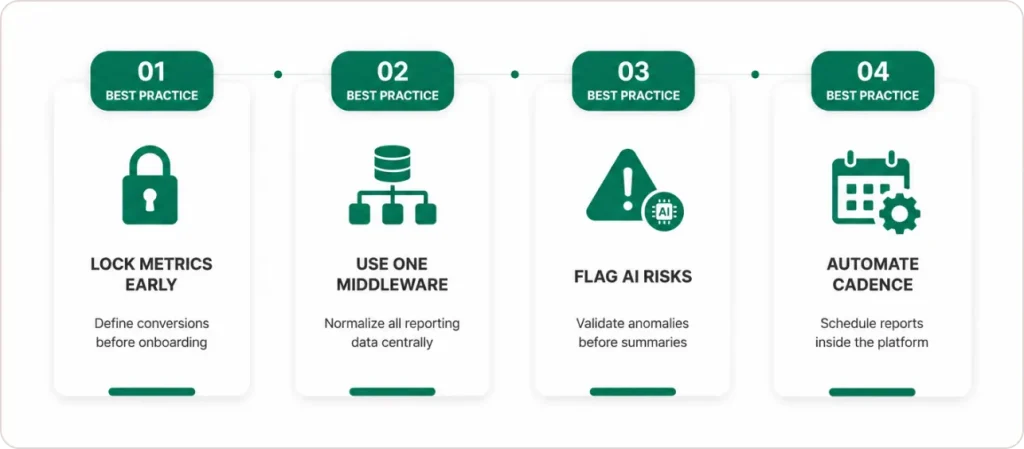
Lock conversion definitions before client onboarding, not after. The most expensive mistake I see agencies make is allowing account managers to build the first client dashboard before the metric definitions are finalized. Once an account manager has spent three hours building a dashboard using a conversion field that is later redefined, you have a trust problem that takes months to resolve. Clients start asking why last month’s 200 conversions became 187 after the “data update.” The fix is organizational, not technical: treat metric definition as part of client onboarding, not as something that gets resolved later.
Use a single middleware connector, not multiple. Many agencies connect Google Ads directly to Looker, Meta directly to Looker, and LinkedIn directly to Looker, using separate native connectors for each. This creates three separate data refresh schedules, three separate permission sets, and three separate points of failure. A single middleware layer such as Funnel.io, Supermetrics, or Windsor.ai normalizes all source data into one destination before it hits your reporting platform. When a connector breaks, you fix one thing, not ten.
Create a “flagged metrics” protocol before enabling AI features. Conversational analytics is only trustworthy if the underlying data is clean. Before turning on Gemini for account managers, designate a data quality owner for each client account. Their job is to flag metric anomalies before AI summaries are generated and sent to clients. Without this, an AI-generated slide deck will confidently summarize a data pipeline error as a performance trend.
Standardize client reporting cadences in the platform, not in the calendar. Most agencies set reporting deadlines in project management tools or email reminders. That system breaks when someone is out of office. Build your weekly and monthly report triggers directly into the analytics platform as scheduled exports or automated notifications. The report runs whether or not the account manager remembers to pull it.
What Real Results Have Agencies and Enterprise Teams Seen?
NBBC Group replaced a spreadsheet-heavy process with Looker Studio Pro and Funnel.io. Report-building time dropped 75%. The team handled four times the previous client dashboard volume without adding headcount. The Gemini slide deck feature alone recovered two to five hours per marketer per week.
Snowflake used ThoughtSpot for ServiceNow analytics to cut its IT backlog by 20% and achieve 99% of IT commit goals. For agencies, the equivalent is freeing senior analysts from repetitive report pulls to work on campaign strategy instead.
JobNimbus, a SaaS platform, embedded Qrvey’s self‑service analytics and achieved 70% adoption among targeted large‑enterprise users.” Customers actively using the analytics features had significantly lower churn rates than those who did not. Clients who have live dashboard access, check their own numbers between calls, and engage with data directly retain longer. The same pattern applies to agency clients.
According to Forrester research, IT-mediated analytics often delays insights by months, driving 41% of organizations to implement self-service analytics platforms. The governance qualifier matters. Ungoverned deployments produce dashboard sprawl and metric inconsistency, not time savings.
What Challenges Will You Actually Face? (And How to Get Through Them)
Data quality breaks AI features first. Before enabling conversational analytics or AI-generated summaries, run a data quality audit on every source you plan to connect. An AI system querying a broken data pipeline generates confident-sounding wrong answers. Clients who receive AI-generated slides summarizing a data error as a performance trend will not forgive it easily.
Adoption stalls at the 30-day mark. Account managers use the new dashboards enthusiastically in weeks one and two, then drift back to spreadsheets because the old habit is faster for the two or three pulls they do every day. Fix this by identifying those specific pulls and building dedicated quick-access views for them inside the platform during the first two weeks of rollout.
The “which number is right” client conversation. Even with a governed semantic layer, clients who have received reports for years will sometimes notice a metric looks different in the new dashboard versus the old spreadsheet. That discrepancy is almost always a calculation the old method got wrong. Document the old and new calculations side by side and walk the client through the difference before they notice it themselves.
What Should You Do Next?
Self-service analytics is no longer optional for agencies that want to scale without burning out their reporting teams.
The path is clear. Audit your current reporting stack. Choose the platform that fits your client ecosystem. Build your semantic layer before anyone logs in. Enable AI features on top of clean, governed data. Run a metric alignment session before go-live. Then measure what you get back.
The agencies doing this properly are recovering 20 to 40 hours per week in reporting labor, handling four times the client volume with the same team, and delivering a client experience that spreadsheet-based agencies cannot replicate. A 75% reduction in report-building time is not exceptional. It is the expected outcome when the infrastructure is right.