Highlights
- Power BI converts scattered data into visual insights that drive smarter decisions.
- Businesses using Power BI report increased ROI—up to 270% over three years, per Forrester.
- Real-time analytics helps companies like Delta Air Lines act on issues instantly.
- Self-service reporting empowers non-technical users with natural language queries.
- Flexible pricing and reduced IT overhead make Power BI highly cost-effective.
- Used by major players like IBM, Mayo Clinic, Walmart, and Bank of America for transformation across HR, healthcare, retail, and finance.
- Start with a free desktop version, scale with Pro or Premium based on needs.
- Power BI supports enterprise-grade security (e.g., row-level access, encryption, GDPR compliance).
- Connects to 100+ systems including Excel, Salesforce, SQL, and Google Analytics.
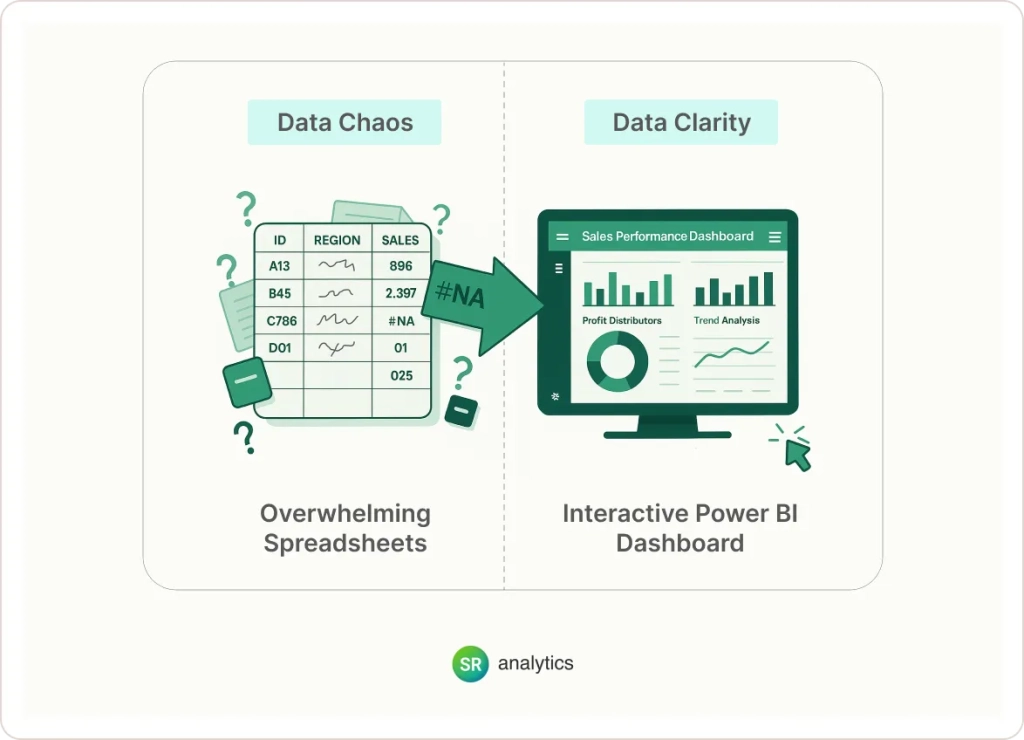
Are you drowning in spreadsheets but starving for actual insights? Effective data visualization isn’t just nice to have — it’s essential for modern business success.
Power BI’s dashboard capabilities are revolutionizing how companies make decisions, breaking down data silos that have held businesses back for decades. Understanding these benefits could be the competitive edge your organization needs.
What Exactly Is Power BI (And Why Should You Care)?
Power BI is Microsoft’s business analytics powerhouse that turns your scattered data into coherent visual stories. It connects to virtually any data source you already use. The platform democratizes data analysis across your entire organization.
I’ve watched countless businesses transform after implementing Power BI. The shift from reactive to proactive decision-making happens remarkably quickly. Even technologically cautious organizations find themselves wondering how they ever operated without it.
The 6 Undeniable Benefits of Power BI for Modern Businesses
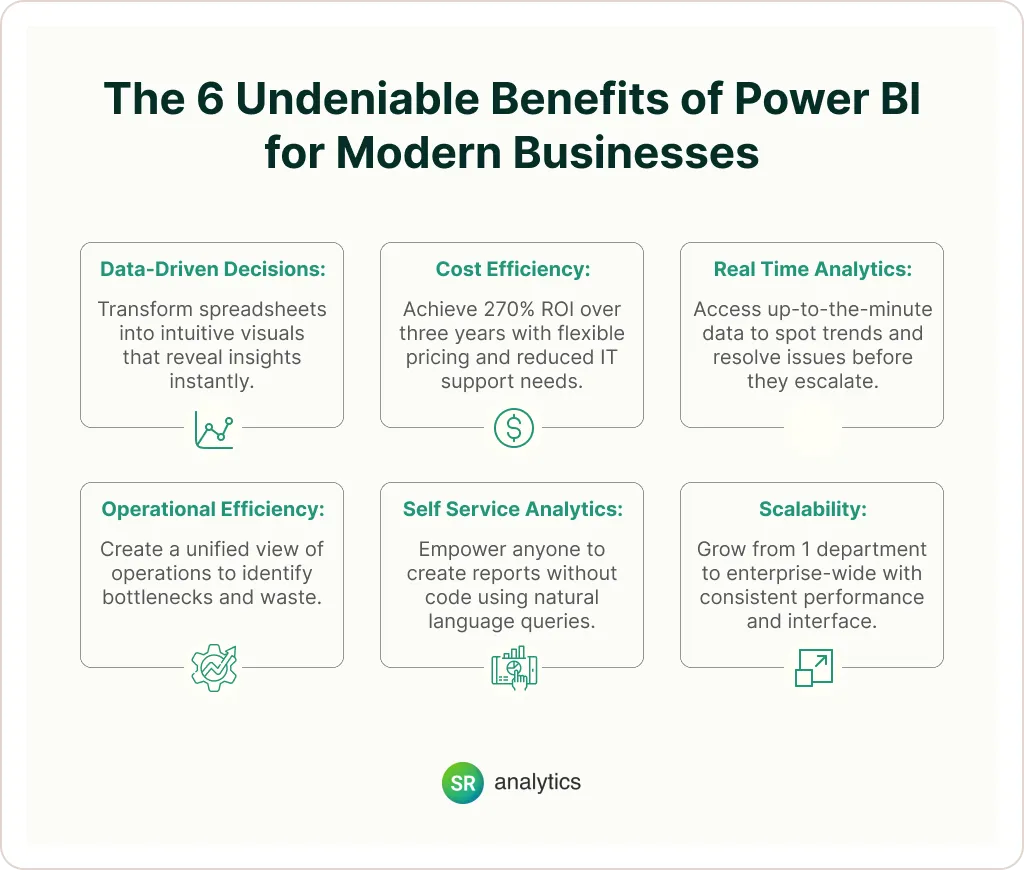
1. Data-Driven Decisions That Eliminate Guesswork
Say goodbye to “I think” and hello to “I know.” Power BI transforms confusing spreadsheets into intuitive visuals that reveal insights instantly. Your team can spot trends, identify issues, and discover opportunities at a glance.
- Complete visibility across business functions
- Real-time trend identification
- Clear connections between seemingly unrelated metrics
- One-click sharing of crucial insights
Real-world impact: IBM’s HR department revolutionized their approach by tracking employee engagement metrics in real-time. Their recruiting decisions and retention strategies improved dramatically once they could visualize patterns previously hidden in raw data.
2. Cost Efficiency That Delivers Measurable ROI
Let’s talk about money. Power BI’s flexible pricing model means you don’t need an enterprise-level budget to get enterprise-level insights. Start small and scale as your needs evolve.
- Tiered pricing starting with a free desktop version
- Consolidation of multiple tools into one platform
- Dramatically reduced IT support requirements
- Automation of time-consuming manual reports
The numbers speak volumes. Forrester found organizations using Power BI achieved 270% ROI over just three years. One manufacturing company documented $78,000 in annual savings through optimized implementation.
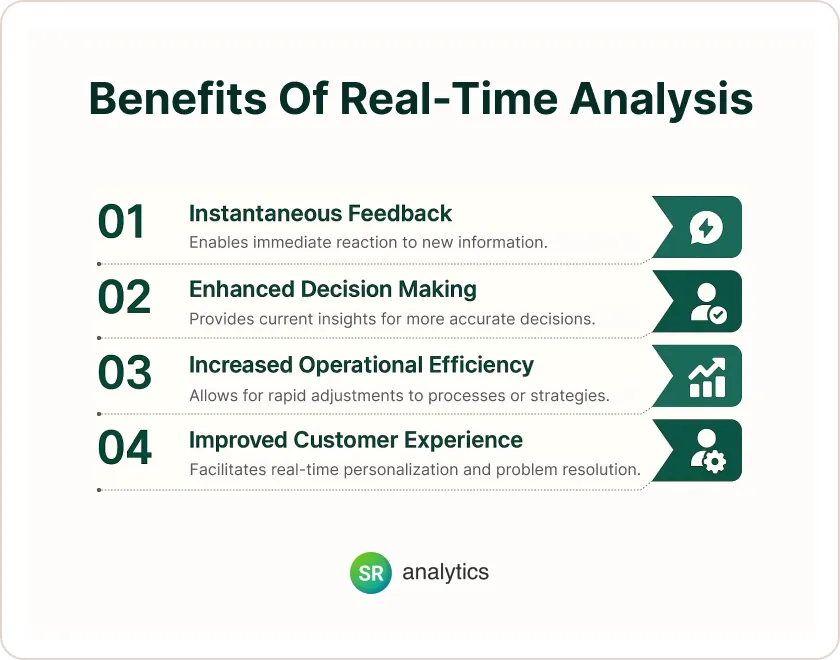
3. Real-Time Analytics When You Need Them Most
In business, timing is everything. Power BI connects directly to your data sources with continuous updates. You’ll always have the most current information at your fingertips.
- Spot problems before they become crises
- Capitalize on trends the moment they emerge
- Make adjustments based on today’s data, not last week’s
- Reduce the delay between insight and action
Delta Air Lines provides a perfect case study. Their customer service team monitors support tickets and satisfaction metrics as they happen. This real-time visibility has simultaneously improved customer satisfaction and reduced operational costs.
4. Operational Efficiency That Eliminates Hidden Waste
Most inefficiencies remain invisible because data lives in disconnected systems. Power BI creates a unified operational view by integrating information from every corner of your business.
- Identify precisely where workflows bottleneck
- Eliminate redundant activities wasting resources
- Predict potential problems before they materialize
- Track the impact of process changes with precision
I’ve seen manufacturing clients transform their operations after connecting production data, inventory systems, and sales forecasts into unified dashboards. Problems that previously took weeks to identify now trigger alerts within minutes.
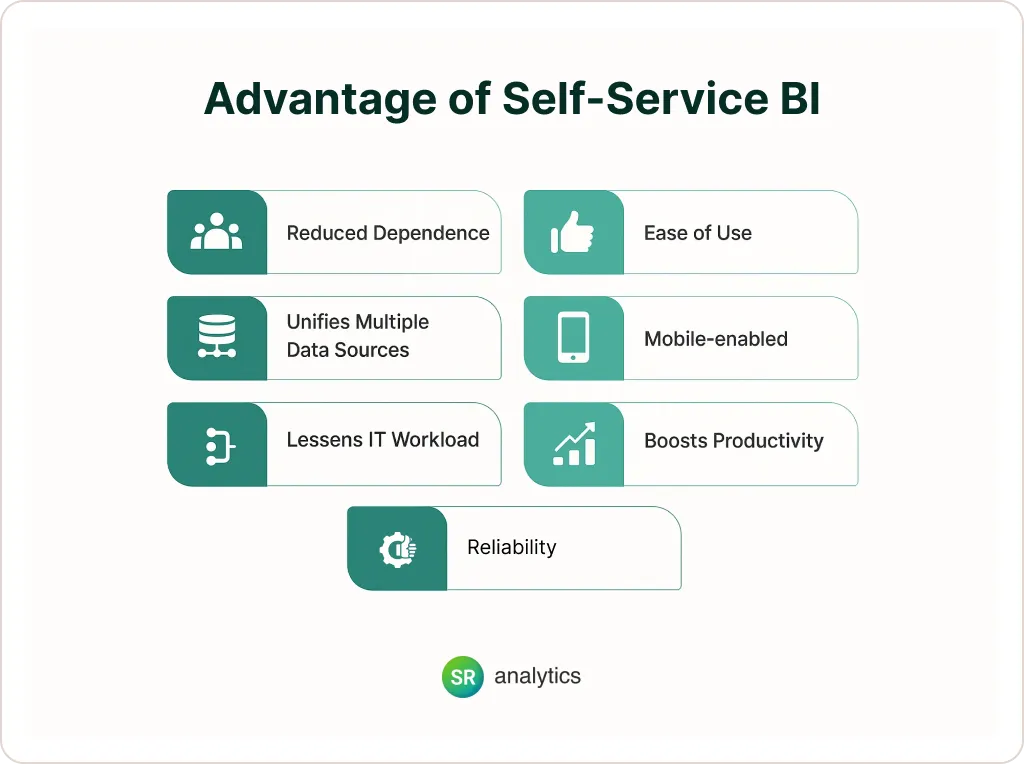
5. Self-Service Analytics Anyone Can Master
The traditional IT bottleneck disappears with Power BI’s intuitive interface. Business users create sophisticated visualizations without writing a single line of code. Information becomes accessible exactly when decisions need to be made.
- Create reports when you need them, not weeks later
- Ask questions in plain English and get visual answers
- Customize dashboards to focus on your priorities
- Free technical teams for higher-value initiatives
The game-changing Q&A feature allows anyone to type questions like “What were sales in California last quarter?” and instantly receive visualizations. This natural language capability transforms how non-technical users interact with data.
6. Scalability That Future-Proofs Your Analytics
Nothing’s more frustrating than outgrowing your solution just as everyone adopts it. Power BI scales seamlessly alongside your business without disruptive migrations or retraining.
- Start with one department and expand organically
- Connect to new data sources as needs evolve
- Handle millions of records with consistent performance
- Maintain the same interface regardless of organization size
This scalability makes Power BI uniquely positioned to serve as your long-term analytics foundation. The platform evolves through regular updates while maintaining interface consistency users depend on.
Power BI Features That Deliver Exceptional Business Value
The benefits of Power BI dashboards stem directly from its robust feature set designed for real-world business challenges.
- Comprehensive Connectors: Link to hundreds of data sources from Excel to enterprise systems
- Power Query: Transform messy data without coding skills
- Data Modeling: Create relationships between disparate data tables
- Visualization Gallery: Choose from standard visuals or custom options
- Natural Language Q&A: Ask plain English questions and receive visual answers
- Mobile Accessibility: View and interact with critical metrics anywhere
These features combine to create a platform that delivers exceptional value regardless of your technical background or business size.
Power BI is a Microsoft platform for interactive data reporting and analytics, enabling users to connect, model, and visualize data from a wide range of sources to drive better business decisions. The video provides a beginner-friendly overview of the Power BI workflow, including data sourcing, transformation, visualization, sharing options, and essential tools for getting started.
How Real Businesses Leverage Power BI Across Industries
The advantages of Power BI manifest differently across sectors, each finding unique ways to transform data into action:
Healthcare: Mayo Clinic uses Power BI to track patient outcomes and optimize resource allocation. Their dashboards provide unprecedented visibility into operational efficiency while improving patient care.
Retail: Walmart analyzes customer behavior and inventory performance across locations. Power BI helps them identify top-performing products and optimize stock levels to reduce costs while maximizing sales.
Finance: Bank of America leverages Power BI for risk assessment and portfolio analysis. Their interactive dashboards deliver immediate insights into market trends and investment performance.
Start Your Power BI Journey Today (It’s Easier Than You Think)
- Download the free desktop version to explore capabilities risk-free
- Connect to everyday data sources like Excel files or business systems
- Build your first dashboard focusing on one critical business area
- Share your insights with key stakeholders to demonstrate value
- Expand methodically based on proven success
The intuitive interface makes adoption remarkably straightforward for most business users. Microsoft’s extensive documentation and community resources support you at every step.
My Perspective: Why Power BI Changes Everything
After helping dozens of organizations implement Power BI, I’ve witnessed a consistent pattern: initial skepticism followed by enthusiastic adoption. The moment when teams first see their data visualized meaningfully often creates an irreversible shift in their analytical mindset.
What makes Power BI truly transformative isn’t just technical capability – it’s the cultural change it enables. When everyone can access insights, organizational decision-making fundamentally improves. Data becomes a shared language rather than a specialized tool.
The companies gaining the most from Power BI aren’t necessarily those with the most data – they’re the ones creating a culture where questions are constantly asked and answered with evidence rather than opinions.
Transform Your Relationship With Data Today
The benefits of Power BI for business extend far beyond prettier charts – they fundamentally change how organizations understand and leverage their information assets. By providing accessible, real-time insights, Power BI empowers everyone to make better decisions.
Whether you’re looking to reduce costs, improve operations, or identify new opportunities, Power BI delivers the tools you need. The platform’s combination of power, flexibility, and ease of use makes it the preferred choice for data-driven organizations everywhere.