If you’ve ever found yourself drowning in spreadsheets, struggling to make sense of scattered data across multiple systems, or desperately needing real-time insights to make critical business decisions… you’re definitely not alone.
When I first started helping small-to-medium businesses transform their data chaos into actionable insights, I was shocked by how many successful companies were making million-dollar decisions based on week-old reports pulled from Excel files.
According to recent market research, businesses are generating 2.5 quintillion bytes of data daily, yet most struggle to transform that data into strategic decisions. Here’s the thing: in 2025, the business intelligence market is expected to reach $13 billion as more organizations rely on data-driven decision making, and companies that don’t adapt are getting left behind fast.
In this guide, I’ll walk you through exactly what Power BI is used for, explore the key features of Power BI that drive results, and show you the advantages of Power BI that make it the go-to solution for companies serious about data-driven growth.
What Is Power BI? (Definition & Core Components)
Core Definition: According to Microsoft, Power BI is “a collection of software services, apps, and connectors that work together to turn your unrelated sources of data into coherent, visually immersive, and interactive insights”. In plain language, it’s your central command center for business analytics.
From my experience working with over 50 clients, here’s what I tell business owners when they ask “what is Power BI”: think of it as the bridge between your scattered data and smart business decisions. It pulls information from everywhere—your CRM, accounting software, website analytics, even Excel spreadsheets—and transforms it into interactive dashboards that actually make sense.
Who Uses Power BI: Both technical and non-technical teams benefit from what Power BI offers. Power BI is designed with a drag-and-drop interface that makes it accessible to users without programming skills, which means your sales manager can build reports just as easily as your IT team.
The Four Core Components:
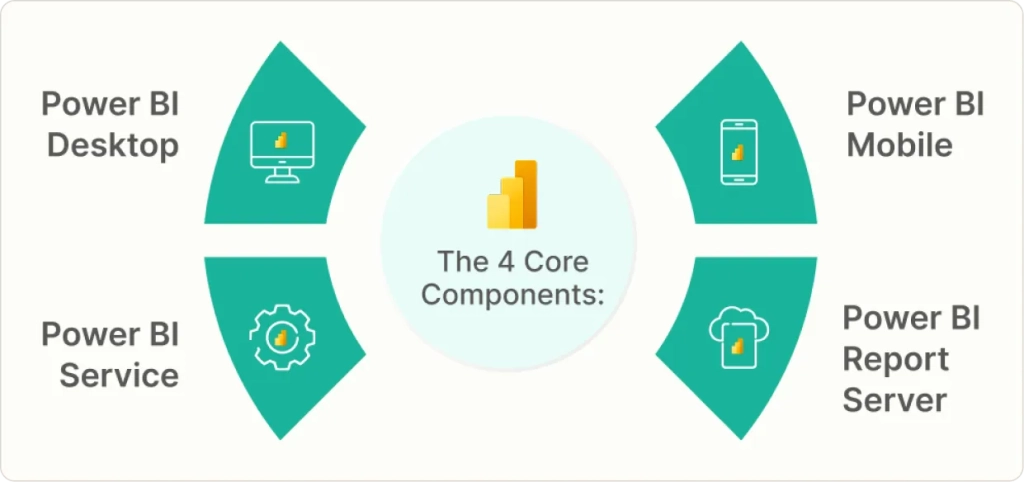
• Power BI Desktop: Free Windows application for building reports and data models
• Power BI Service: Cloud-based platform for sharing dashboards and collaborating online
• Power BI Mobile: iOS, Android, and Windows apps for viewing dashboards on-the-go
• Power BI Report Server: On-premises solution for organizations requiring data to stay behind their firewall
Pro tip: Start with the free Desktop version to test your data connections before investing in Pro licenses. This approach saves both time and budget during the evaluation phase.
Key Features of Power BI That Drive Business Value
Let me be honest with you: features of Power BI only matter if they solve real business problems. Here’s what I’ve learned makes the biggest operational impact:
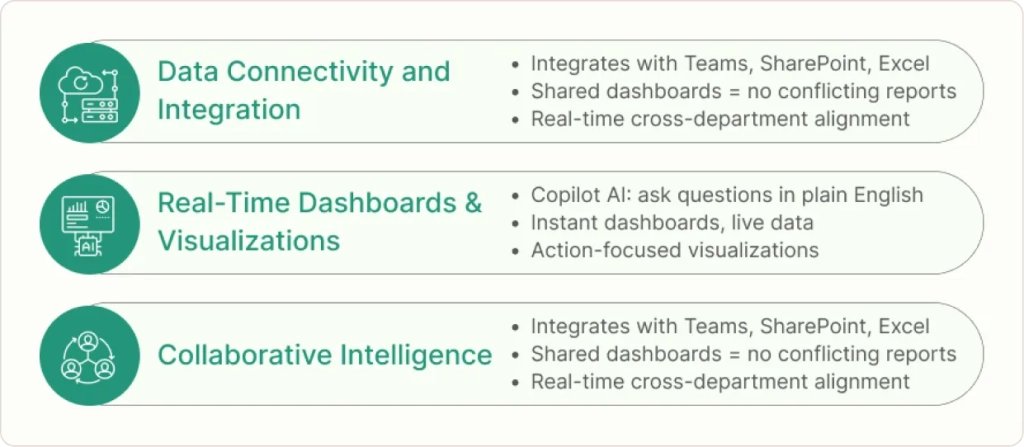
1. Data Connectivity & Integration
Power BI connects to hundreds of data sources—from Excel files and SQL databases to cloud services like Salesforce and Google Analytics. The built-in Power Query engine handles data cleaning and transformation without requiring coding skills.
Here’s what I always tell clients about what Power BI is used for: if you can access your data somehow, Power BI can probably connect to it. I’ve helped companies integrate everything from legacy manufacturing systems to modern SaaS platforms, creating unified views that were previously impossible.
2. Interactive Visualizations & Real-Time Dashboards
The May 2025 Power BI updates introduced enhanced AI capabilities including a standalone Copilot feature that allows users to ask questions in natural language. This means your team can literally ask “What were our top-performing products last quarter?” and get instant visual answers—demonstrating one of the most powerful uses of Power BI.
Red flag alert: Don’t fall into the trap of creating “pretty” dashboards that don’t drive action. Focus on metrics that directly impact business decisions.
3. Collaborative Intelligence
Power BI integrates seamlessly with Microsoft Teams, SharePoint, and other Office 365 applications, ensuring your insights reach the right people at the right time. When all departments use the same dashboards, you eliminate conflicting reports and create a single source of truth.
One of my favorite client success stories involves a manufacturing company where the sales team and production team were constantly arguing about capacity. After implementing shared Power BI dashboards, they could both see real-time production data and sales forecasts on the same screen. Arguments became collaborative planning sessions overnight.
What Is Power BI Used For? (Real-World Applications)
Understanding what Power BI is used for across different business functions helps you see the full potential of this platform. Here’s where Power BI really shines—solving actual business problems across every department:
Sales & Marketing Analytics
One of the primary uses of Power BI is enabling sales teams to track performance metrics, identify high-value opportunities, and forecast revenue. Marketing departments create dashboards showing campaign ROI, lead generation, and customer acquisition costs.
I recently worked with a jewelry retailer who was struggling with inventory management. Their Power BI dashboard now shows real-time sales velocity by product category, seasonal trends, and optimal reorder points. The result? They reduced excess inventory by 30% while eliminating stockouts on popular items.
Financial Reporting & Budgeting
Finance teams leverage the features of Power BI for monthly closings, budget vs. actual analysis, and cash flow forecasting. Complex financial data becomes clear dashboards that executives can understand at a glance.
Operations & Manufacturing Excellence
Operations managers use Power BI to monitor KPIs like production efficiency, quality metrics, and equipment downtime. Power BI’s real-time capabilities allow manufacturers to stream sensor data and trigger alerts when metrics go out of range.
Case Study: One of our manufacturing clients implemented Power BI dashboards that monitor machine temperature, throughput, and maintenance schedules. When a critical machine started showing temperature spikes, automated alerts prevented a costly breakdown that would have shut down production for 48 hours.
Human Resources Analytics
HR departments discover what Power BI is used for in workforce analytics, tracking employee turnover, recruitment pipeline performance, and satisfaction survey results. By spotting trends early, HR can proactively address retention issues.
Customer Success & Service Operations
Companies analyze customer data through Power BI dashboards showing support ticket trends, customer satisfaction scores, and usage patterns. This helps identify at-risk customers before they churn.
For expert guidance on implementing these analytics solutions across your organization, our business intelligence consulting services help companies design and deploy Power BI systems that deliver measurable results from day one.
Advantages of Power BI for Business Operations
From my experience helping businesses implement analytics solutions, here are the advantages of Power BI that create the most operational value:
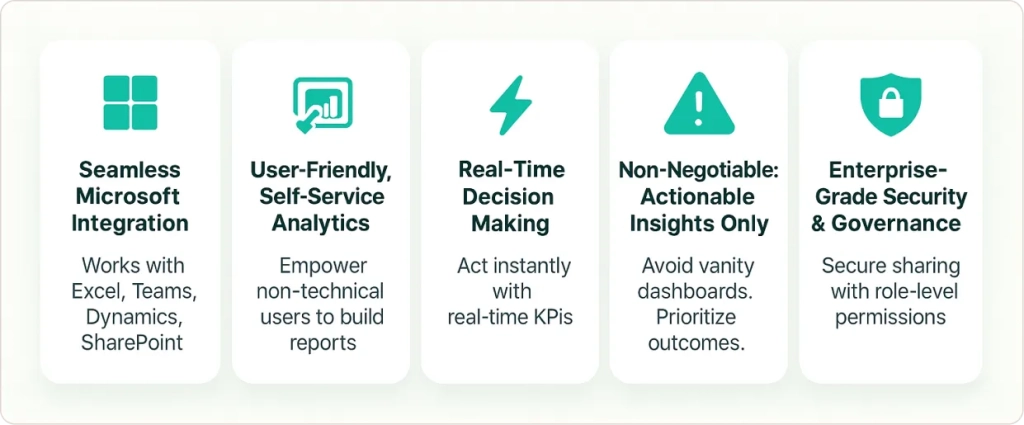
Seamless Microsoft Ecosystem Integration
Being part of the Microsoft ecosystem represents one of the key advantages of Power BI. Power BI integrates natively with Excel, Azure, SharePoint, Teams, and Dynamics 365. For organizations already using Microsoft tools, adoption becomes dramatically easier and more cost-effective.
User-Friendly, Self-Service Analytics
Here’s my rule about what makes Power BI special: if your business users can’t create basic reports themselves, your BI tool is too complex. Power BI’s drag-and-drop interface democratizes data access, reducing dependence on IT teams for routine reporting.
Real-Time Decision Making
The real-time capabilities represent major advantages of Power BI, enabling businesses to react faster to market changes and operational issues. In today’s competitive environment, the speed of decision-making often determines business success.
Non-negotiable:
Ensure your implementation focuses on actionable metrics, not vanity dashboards. I’ve seen too many companies get excited about beautiful visualizations that don’t drive business outcomes.
Enterprise-Grade Security & Governance
Power BI provides row-level security, data encryption, and compliance features that meet enterprise requirements. This allows companies to confidently share sensitive financial and operational data across teams.
How Power BI Impacts Business Operations
When I work with companies implementing Power BI, here’s the transformation I consistently see across various uses of Power BI:

1. Enhanced Decision-Making Speed & Accuracy
“Power BI is a true game-changer,” shares one of our clients. “We cut significant time on our data reporting and analysis process. With Power BI, we can collaborate better across departments and optimize our operations in a way we couldn’t before.”
Research shows that organizations with high BI adoption rates are 5 times more likely to make faster and better-informed decisions. The difference between companies that succeed with data and those that struggle often comes down to how quickly they can act on insights.
2. Operational Efficiency & Cost Reduction
Power BI automates reporting tasks that previously consumed hours of manual work. Scheduled data refreshes and automated alerts mean employees spend less time creating reports and more time acting on insights.
Another client told us: “We’ve been able to decrease the workload of almost half an FTE by now having more direct access to reporting. We’re starting to see a reduction in our inventory levels through tighter management.”
3. Cross-Departmental Collaboration
When all departments understand what Power BI is used for in their specific context, it creates alignment around shared metrics and goals. Marketing and sales teams coordinate on the same lead scoring models. Production and inventory teams share real-time capacity data.
4. Proactive Risk Management
By visualizing operations end-to-end, organizations detect problems before they become crises. Real-time alerts can prevent equipment failures, identify budget overruns, or flag customer churn risks while there’s still time to act.
For businesses needing expert support in maximizing these operational benefits, our data analytics consulting services provide the strategic guidance to turn your Power BI investment into measurable business results.
Implementation Best Practices & Common Pitfalls
Here’s what I’ve learned after years of helping companies implement Power BI successfully:
Start With Business Questions, Not Technology
Before touching any software, define what business questions you need answered. “How can we reduce customer churn?” is much more valuable than “Let’s build a customer dashboard.”
Ensure Data Quality From Day One
Clean, accurate data is non-negotiable. Studies show that data quality and accuracy represent the top challenge in Big Data initiatives, cited by 40% of organizations. Invest in proper data preparation before building dashboards.
Plan Your Licensing Strategy
The smartest approach often combines different Power BI license types, with creators using Pro licenses and viewers accessing through Premium capacity. This mixed approach delivers optimal value for growing organizations.
Focus on User Adoption
The most sophisticated analytics platform fails if people don’t use it. Provide training, create simple getting-started guides, and celebrate early wins to build momentum.
Red flag alert: Avoid creating overly complex dashboards that overwhelm users. Start simple and add complexity based on actual user needs.
Real-World Success Stories
Manufacturing Excellence: SR Analytics helped Lifepro Fitness enhance operational efficiency through comprehensive Power BI solutions. The global fitness equipment retailer needed to centralize reporting, automate data workflows, and optimize decision-making across their supply chain operations.
Financial Services Innovation: We supported Pinnacle Fund Services in streamlining investment analysis and reporting with powerful Power BI dashboards. The fund management firm now tracks key financial metrics, improves asset analysis, and enhances investor performance evaluations through real-time analytics.
Healthcare Operations: “SR Analytics transformed the way we manage data at Precise Imaging,” reports another client. “Their custom Power BI dashboards gave us real-time visibility into billing, scheduling, and operations—helping us reduce no-shows and improve decision-making.”
These success stories demonstrate how understanding what Power BI is used for and implementing the right analytics solutions delivers measurable business impact across industries.
Taking Action: Your Next Steps
The data you’re generating right now contains the insights needed to outperform your competition, optimize your operations, and delight your customers. The question isn’t whether you have valuable data—it’s whether you’re equipped to unlock its potential through the powerful uses of Power BI.
For businesses ready to transform their data into competitive advantages, our data engineering services ensure your data infrastructure can support both current needs and future growth. Whether you’re modernizing legacy systems, integrating cloud platforms, or setting up real-time analytics, we provide the expertise to make it happen.
Don’t let another quarter pass while your competitors gain ground through better data insights. Now that you understand what Power BI is used for and the advantages of Power BI for your business operations, the time to act is now—and the tools to succeed are within reach.